Perpetual futures are derivatives without a fixed expiry. Unlike spot purchases, they provide contract exposure rather than ownership of the asset. This guide covers USDT-linear contracts only. Using Gate's official product introduction as context, it explains position size and margin, then follows historical BTC prices to calculate a cost-inclusive budget and check exit-price touches. Fills and fees are separate assumptions. Do not trade live before checking the applicable rules; a budget does not guarantee a maximum loss.
You have 10,000 USDT in your account and want to risk only 50 USDT on this trade. Divide that budget by the distance from entry to stop, and the size seems settled. But the final calculation also includes entry and exit fees, possible slippage and funding. Does that 50 mean the price loss alone, or the budget for the whole trade? Without answering that question, a correct-looking calculation can still exceed the budget.
What matters more to me is whether you can follow the chain from the product you select to the records left after you exit. We will first explain the concepts, then revisit a historical short used elsewhere on this site and build a cost-inclusive example. This is not my live trading experience, and it does not prescribe one leverage setting for every beginner.
Key points
- Set the risk budget and quantity first, then check margin requirements. Changing leverage on the same quantity does not directly change price profit and loss (P&L).
- An order trigger, an actual fill and platform liquidation are different events. Check them separately.
- A fee reserve is an input to a forward calculation. Actual costs still need reconciliation; missing data is not zero.
Perpetual futures: separate the product, position size and margin
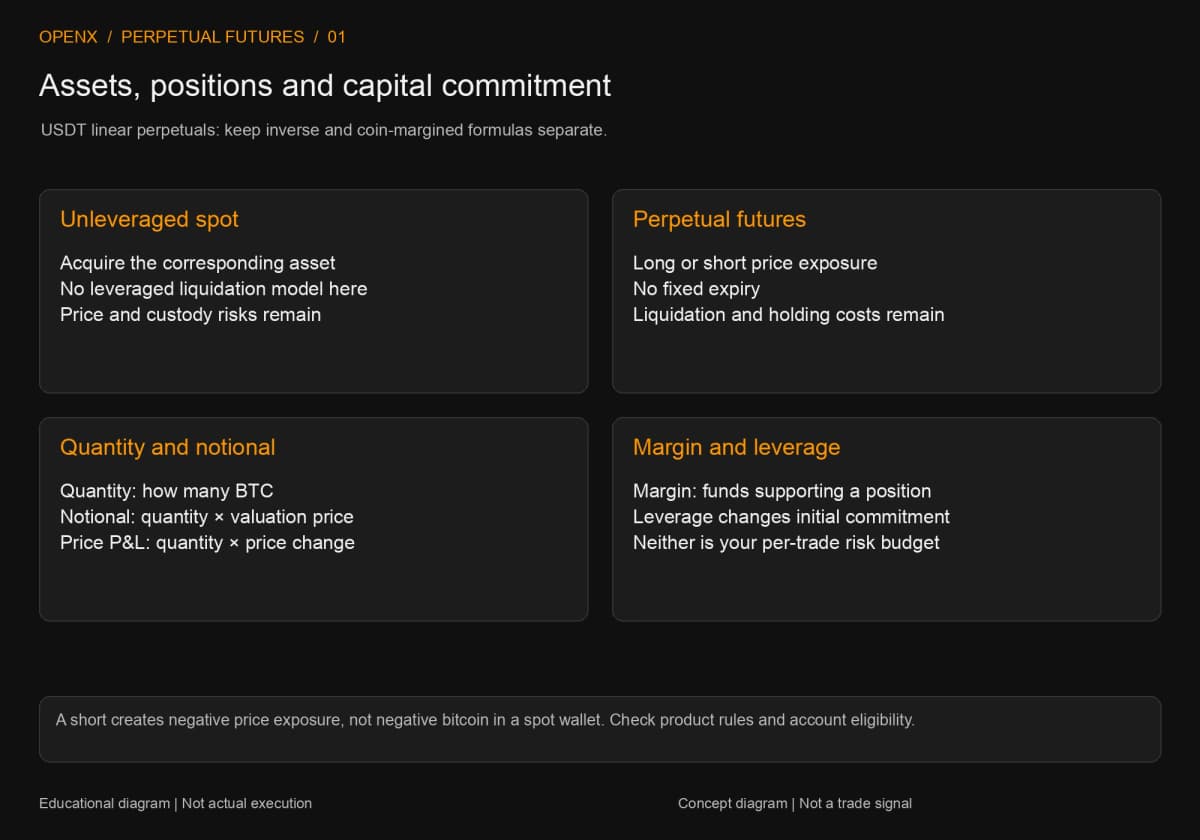
A perpetual contract gives you exposure to changes in the underlying price; it does not put that asset in your wallet. This guide covers linear perpetuals quoted in USDT, with quantity expressed in BTC. USDT is a stablecoin, but that does not remove risks relating to its value or issuer. Do not apply every formula below to coin-margined, inverse or differently settled contracts.
Perpetuals and spot purchases are different products
An ordinary spot purchase gives your account the corresponding asset. A BTCUSDT perpetual position gives you exposure to Bitcoin price changes under the contract's rules. No fixed expiry does not mean you can hold indefinitely: funding may continue to settle, and an insufficiently margined position may be liquidated. Gate's official perpetual-contract introduction distinguishes product types and live versus simulated trading.
A long has positive price P&L when price rises; a short works in the opposite direction. For a linear short, price P&L is quantity × (entry price − exit price), with costs checked separately. Why you choose a particular entry is a strategy question. Start with the SMC strategy guide for that decision process; knowing a product's mechanics does not create a trading edge.
With quantity fixed, leverage first changes the margin requirement
Position quantity is how many BTC you hold. Notional value is that quantity multiplied by the valuation price. Margin is the money supporting the position. Selected leverage affects the initial margin required. With the same quantity and entry and exit prices, moving from 5x to 10x does not double price P&L. Market exposure increases if you use the released funds to increase quantity.
Bybit's official P&L Calculations and Initial Margin documents explain linear P&L and margin calculations. Notional value divided by leverage is a starting comparison, but a platform may value the position at mark price and include an estimated closing fee. This shortcut is neither an available-to-trade balance nor a liquidation formula.
What isolated margin, cross margin and liquidation each control
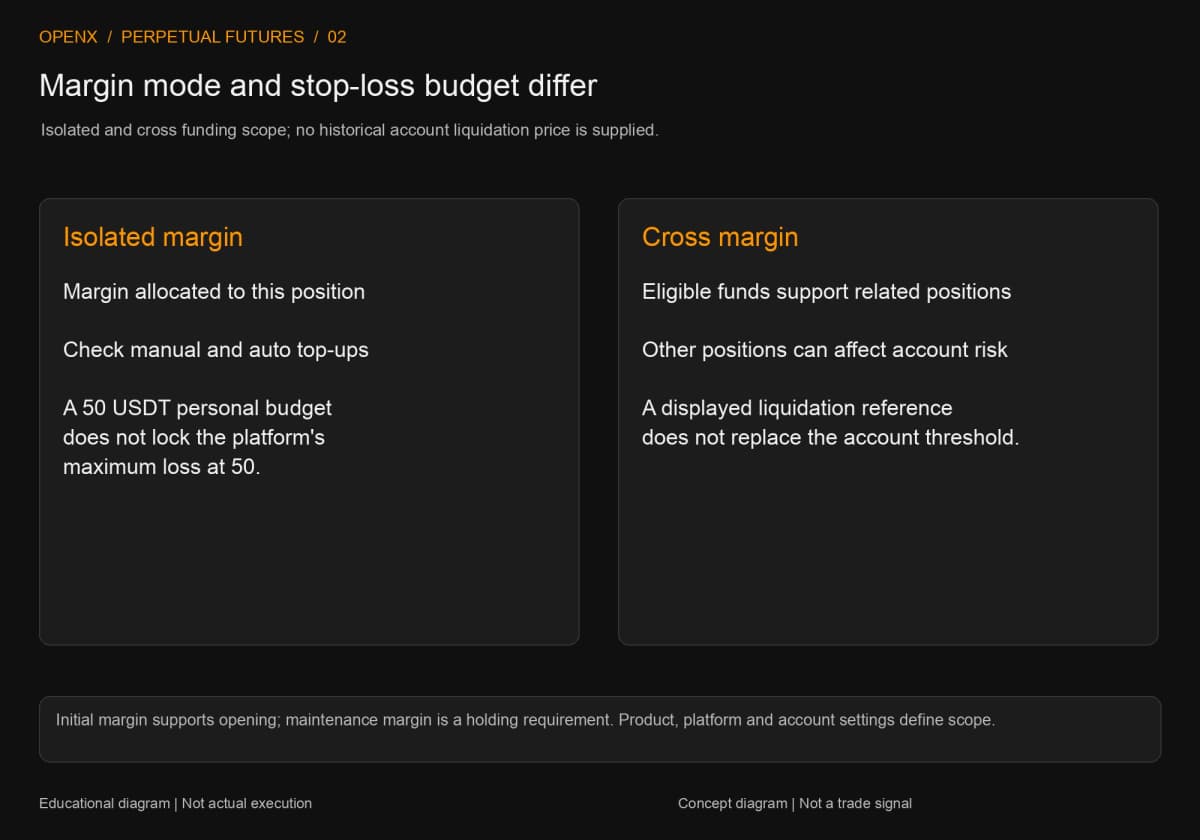
Margin mode determines which funds support a position. Liquidation rules determine when the platform intervenes. Neither is the trader's own stop-loss rule. After selecting a mode, you still need to check account equity, maintenance requirements and exit orders rather than rely on a displayed liquidation price alone.
Margin mode determines which funds may be used
Isolated margin generally separates the margin allocated to a position. Cross margin may let multiple positions share eligible funds within the relevant account. Adding margin, enabling automatic additions or changes in other positions' P&L can change that support. Selecting isolated margin does not lock your chosen 50 USDT risk budget into a platform-guaranteed loss cap. For a comparison using one consistent ledger, see isolated vs cross margin.
Initial margin is required to open a position; maintenance margin is the requirement for keeping it open. Gate's introduction also discusses closing fees and risk limits. Product and account rules differ, so one exchange's formula is not automatically another exchange's account rule.
A candle chart alone cannot compare mark price with a stop trigger
Last traded price is the price of the latest fill. Index price is a benchmark formed from reference markets. Mark price is the platform's reference for valuation and risk management. Bybit's official Order Execution and Liquidation documentation describes different liquidation criteria for isolated and cross margin. A reference liquidation price displayed for cross margin does not replace the account-level risk conditions.
If a stop uses last traded price while liquidation references mark price, the two prices may reach their thresholds in a different order. A candle that has not touched the stop therefore does not prove the account cannot be liquidated. The example below lacks contemporaneous mark-price and account data, so we do not invent a historical liquidation price.
Define exits and cost assumptions before placing an order
A checkable plan specifies the entry method, quantity, exit trigger source, order type after triggering and cost assumptions. Direction and a stop price alone do not explain how the order will execute. Fix these conditions before comparing the budget with an outcome.
Limit, market and conditional orders execute differently
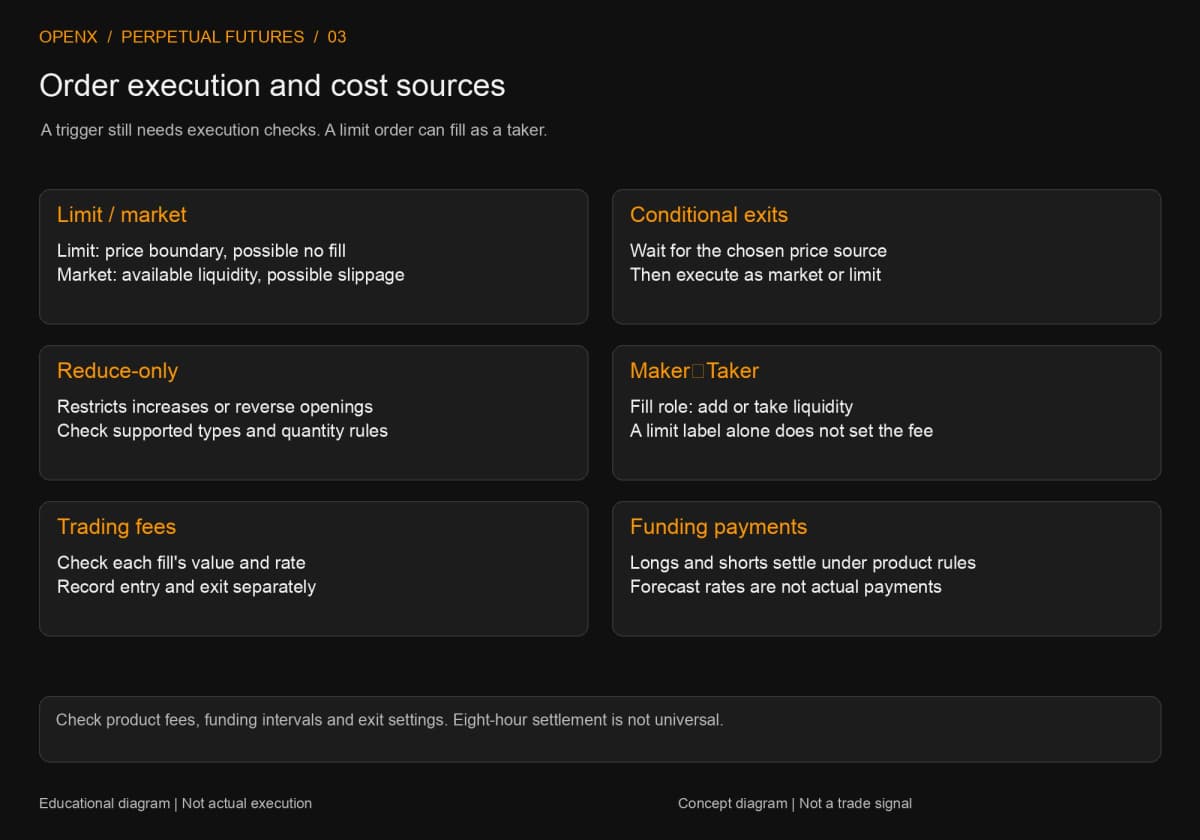
A limit order restricts the acceptable price. A touch can still leave it queued, partially filled or unfilled. A market order seeks available counterparties, so its average fill can differ from the displayed quote: that difference is slippage. A conditional order first waits for the selected price trigger, then submits a market or limit order as configured. Triggering does not mean the position has exited.
Check the closing quantity and direction as well. Reduce-only restricts an order from increasing a position or opening one in the opposite direction. Bybit's official Reduce-Only Order document explains this using limit exit orders. Supported order types and attached-order arrangements differ by platform. Check the settings and remaining orders; seeing the words reduce-only does not mean every exit risk is resolved.
Trading fees and funding are charged differently
Trading fees depend on the filled value and applicable rate. A maker provides liquidity; a taker removes existing liquidity. A limit order that immediately matches a resting order can be a taker. This distinction follows Bybit's Order Execution and Liquidation documentation. Apply the actual product and account fee schedule.
Funding is a payment between perpetual-contract longs and shorts under settlement rules; the funding rate determines its size. Positive rates commonly mean longs pay shorts, with the direction reversed for negative rates. OKX's official perpetual funding rules describe different intervals and adjustment conditions. Do not assume every product settles every eight hours, or treat today's estimated rate as a past account charge.
Historical BTC example: account for the full 50 USDT budget
We will use Binance BTCUSDT perpetual prices from its USDⓈ-M Futures Kline/Candlestick Data for September 10–11, 2026, to allocate a 50 USDT budget between price risk and costs. Build the plan on four-hour candles, then examine fifteen-minute candles for entry and stop timing. Times use Coordinated Universal Time (UTC); add eight hours for UTC+8. A candle's timestamp is its opening time. Its complete high and low are available only after it closes.
This is a teaching reconstruction of known historical prices, with no actual orders submitted. The account, fee rates, fills and slippage are illustrative inputs. The result is not live performance or evidence that the strategy works. The 50 USDT budget is an exercise input, not a recommended risk allocation for everyone.
Step 1: Fix the known levels and cancellation conditions
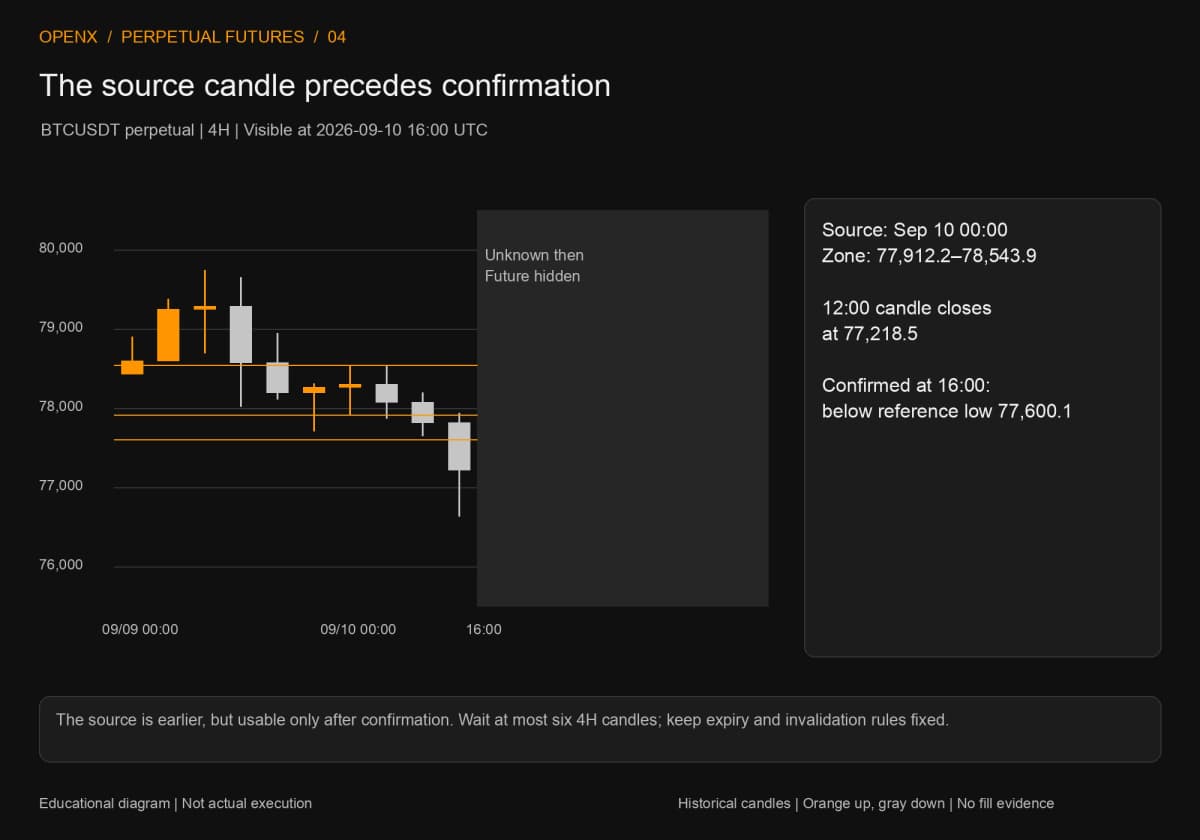
Use the source candle's complete high-to-low range, including wicks. Reject the candidate if the preceding six candles contain no bullish candle, or price has already exceeded the source high before confirmation. The original rule waits for a four-hour close below the completed September 8 daily low of 77,600.1, then selects the most recent bullish candle among the six candles before the break. The September 10 candle opening at 12:00 closes at 77,218.5 and confirms only at 16:00. The source opens at 00:00 that day and spans 77,912.2–78,543.9. No intervening high exceeds the upper edge. Waiting for a retest starts after confirmation.
Assume a limit short at the first retest of the lower edge, 77,912.2, with a price stop of 78,600.0 and fixed target of 76,536.6. Wait from September 10 at 16:00 until before September 11 at 16:00: six four-hour candles. Cancel if there is no touch before expiry. Also cancel before entry if a four-hour candle closes above the upper edge, or the next fifteen-minute candle opens directly above it. Do not assume a fill at the lower edge in that case.
This exercise checks touches using last-traded-price candles and separately assumes a full entry fill. The stop model buys at market to close the short when last traded price reaches or exceeds 78,600.0. The target model uses a buy limit to close when price reaches or falls below 76,536.6. These are exercise rules, not recovered historical orders. Without execution reports, leave actual fills blank.
Step 2: Include costs and reduce the quantity to 0.062 BTC
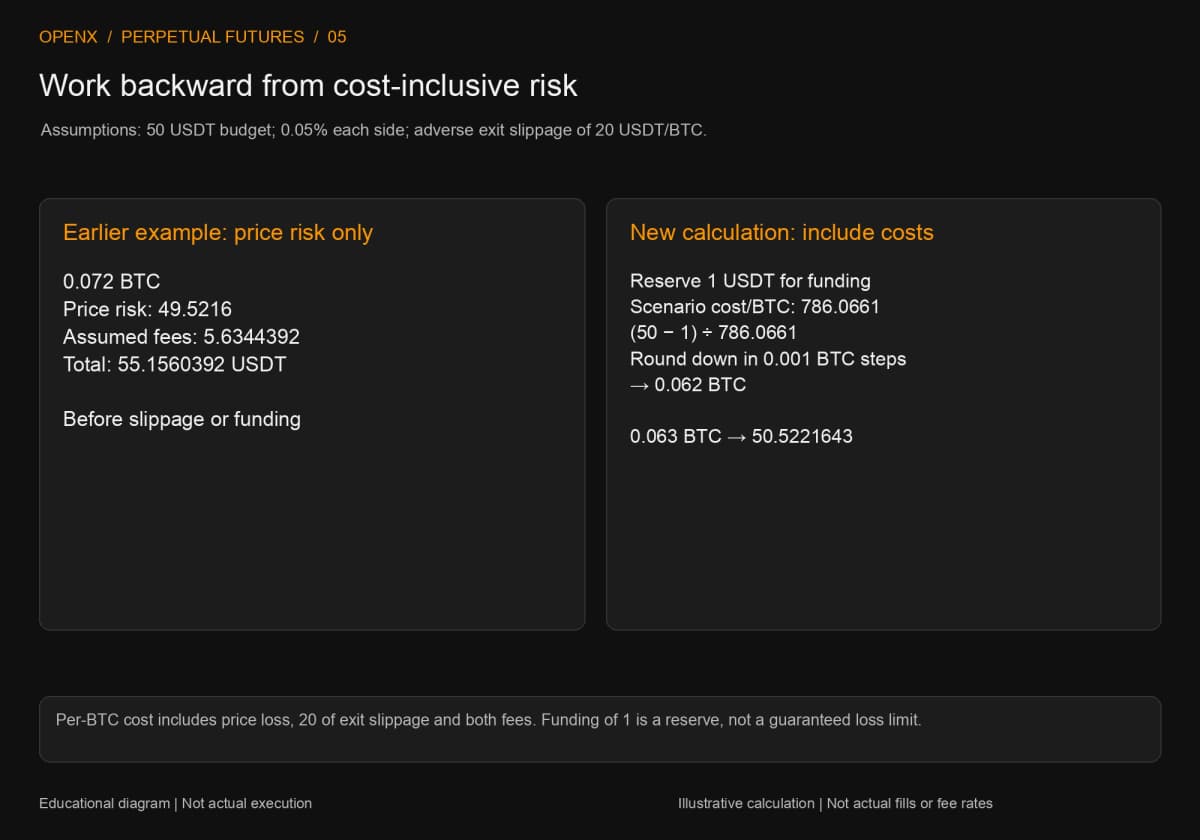
First, see why the old calculation exceeds the budget. Assume a 10,000 USDT account and a 50 USDT budget. The stop distance is 687.8 USDT per BTC. A quantity of 0.072 BTC gives price risk of 49.5216. With assumed fees of 0.05% on each side, trading fees add 5.6344392, bringing the sum to 55.1560392 USDT before slippage and funding.
The new exercise retains the illustrative 0.05% fee on each side and assumes entry at the specified price. Allow 20 USDT per BTC of adverse exit slippage, giving an exit-cost scenario at 78,620.0. Separately reserve 1 USDT for possible funding payments. These are not the day's actual rates, slippage or charges, and they do not cap slippage at 20.
Fees change with quantity, so you cannot solve the quantity first and casually subtract a fixed fee afterward. The scenario cost per BTC is:
(78,620.0 − 77,912.2) + (77,912.2 + 78,620.0) × 0.0005 = 786.0661 USDT.
Calculate the quantity cap as (50 − 1) ÷ 786.0661. Round down in the exercise's assumed 0.001 BTC increment to obtain 0.062 BTC. This increment is an exercise input; live product specifications require a separate check. At 0.063 BTC, the same scenario plus reserve reaches 50.5221643 USDT and exceeds the budget.
The purpose is to recalculate costs as quantity changes. It exposes the cost gap in the earlier example without proving that the new size suits every market. Historical candles supply the prices, while fees follow the stated assumptions. To add a separate cap on capital committed, continue to futures position sizing and calculate both limits.
Step 3: Check margin requirements and exit settings
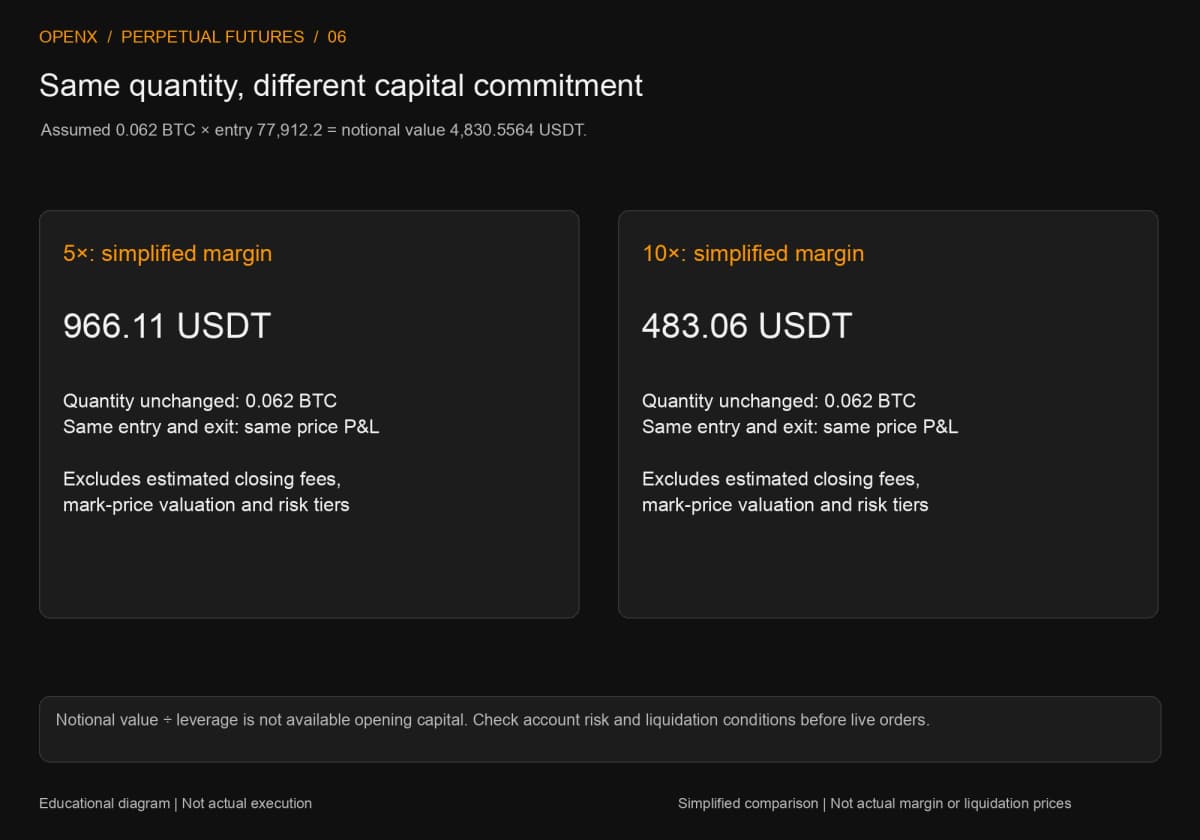
At the entry price, 0.062 BTC has notional value of 4,830.5564 USDT. Using only notional value ÷ leverage gives approximate margin comparisons of 966.11 at 5x and 483.06 USDT at 10x. Price P&L is unchanged with quantity and entry and exit prices fixed. Neither figure includes actual platform valuation, estimated closing fees or risk tiers, so neither proves the account can open the position or has an adequate liquidation buffer.
In a simulation environment, check the product, isolated or cross mode, direction and quantity, then the buy-to-close stop for the short. If only 0.03 BTC fills, adjust exits to the actual remaining quantity rather than treating the planned 0.062 as fully held. Check whether exits cover the whole position or use reduce-only under the platform's rules. Do not submit a live order while margin and risk conditions remain unresolved. This example lacks that account evidence, so it completes only budget calculations and historical price-touch analysis.
Step 4: Check price touches in fifteen-minute order
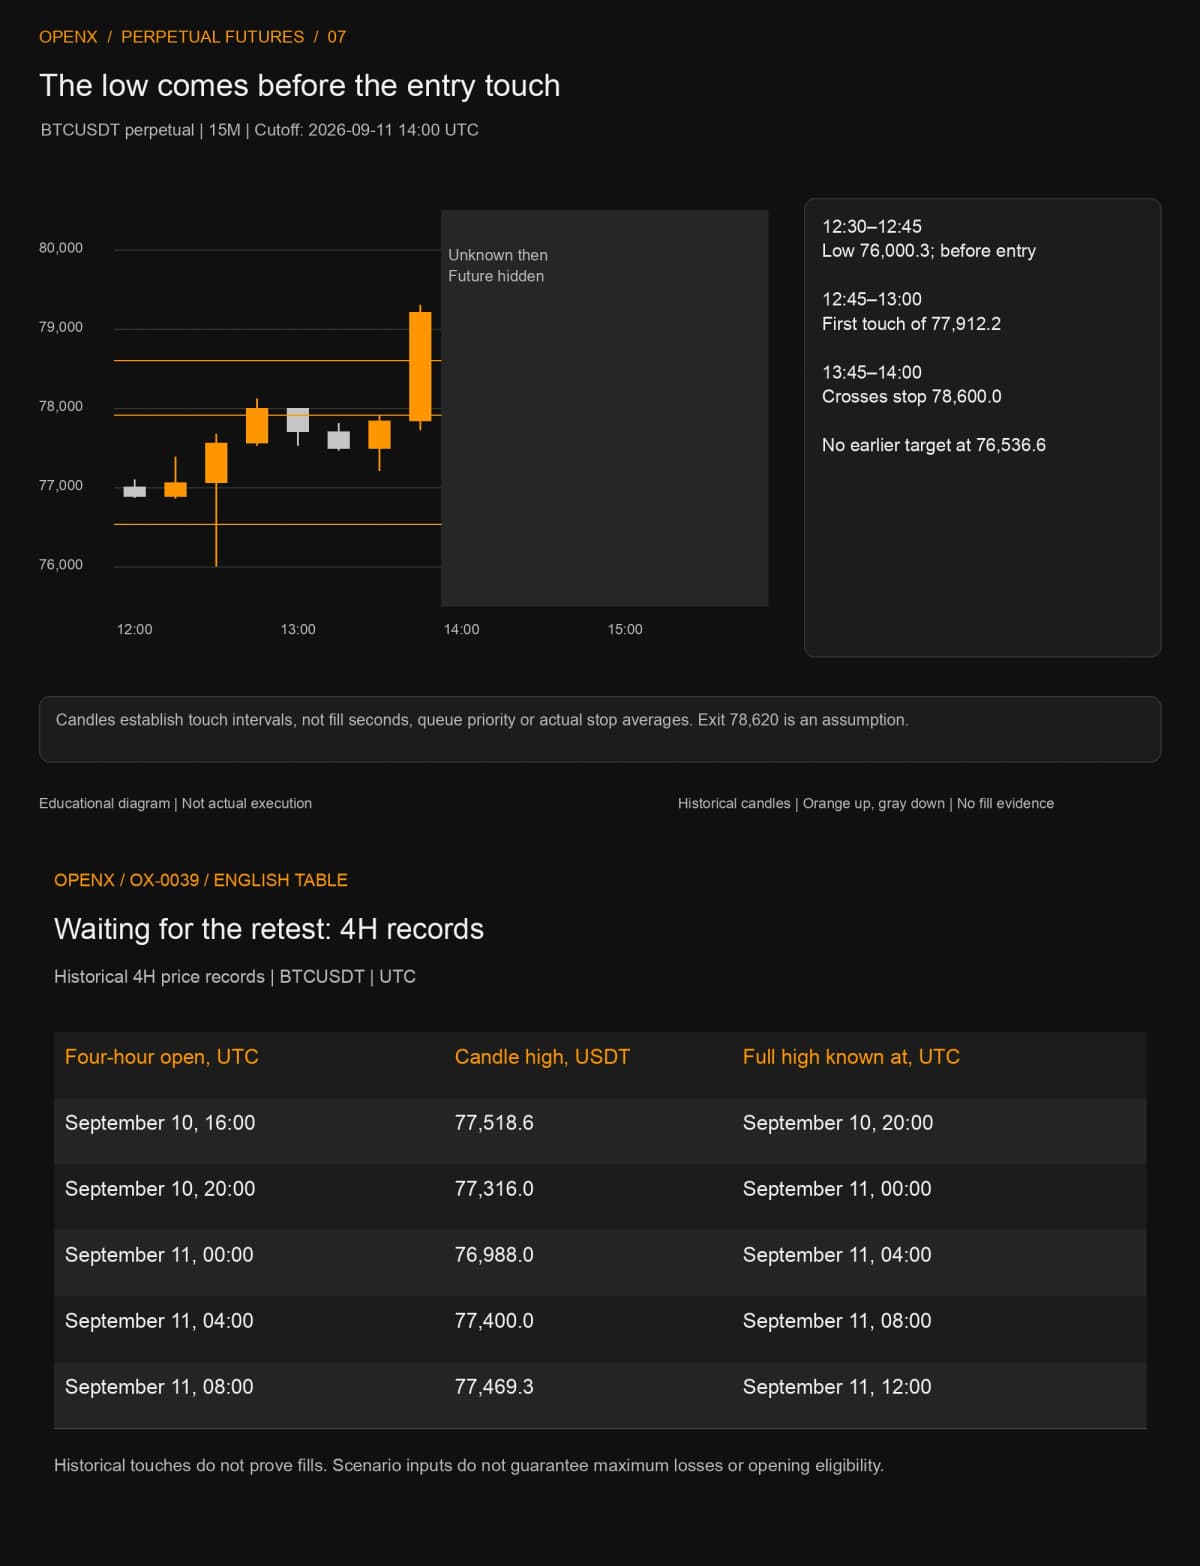
The first five four-hour candles after confirmation all have highs below 77,912.2. The table is for reviewing the completed history; each full high becomes known only at that candle's close.
| Four-hour open, UTC | Candle high, USDT | Full high known at, UTC |
|---|---|---|
| September 10, 16:00 | 77,518.6 | September 10, 20:00 |
| September 10, 20:00 | 77,316.0 | September 11, 00:00 |
| September 11, 00:00 | 76,988.0 | September 11, 04:00 |
| September 11, 04:00 | 77,400.0 | September 11, 08:00 |
| September 11, 08:00 | 77,469.3 | September 11, 12:00 |
The candle opening September 11 at 12:00 contains the entry, stop and target within its range. That candle alone cannot establish their order. In fifteen-minute data, the 12:30 candle first falls to 76,000.3, but its high is only 77,671.4. Entry has not been touched, so this decline cannot count as profit on the short.
The first entry-price touch is in the 12:45–13:00 interval, with a high of 78,115.4 and low of 77,527.8. That does not establish a fill at exactly 12:45. The 13:00, 13:15 and 13:30 candles have lows of 77,526.4, 77,464.6 and 77,211.4. None of these or the entry candle reaches 76,536.6. In the 13:45–14:00 interval, the high reaches 79,300.7 and crosses the 78,600.0 stop; the low of 77,720.0 remains above the target. Under the simplified specified-price fill model, the stop touch therefore comes first.
This establishes the order of price events, not queue position, the actual stop-trigger source or an average fill. The 78,620.0 exit remains the cost assumption fixed earlier; it is not a fill read from that candle.
Step 5: Separate assumed P&L from unknown costs
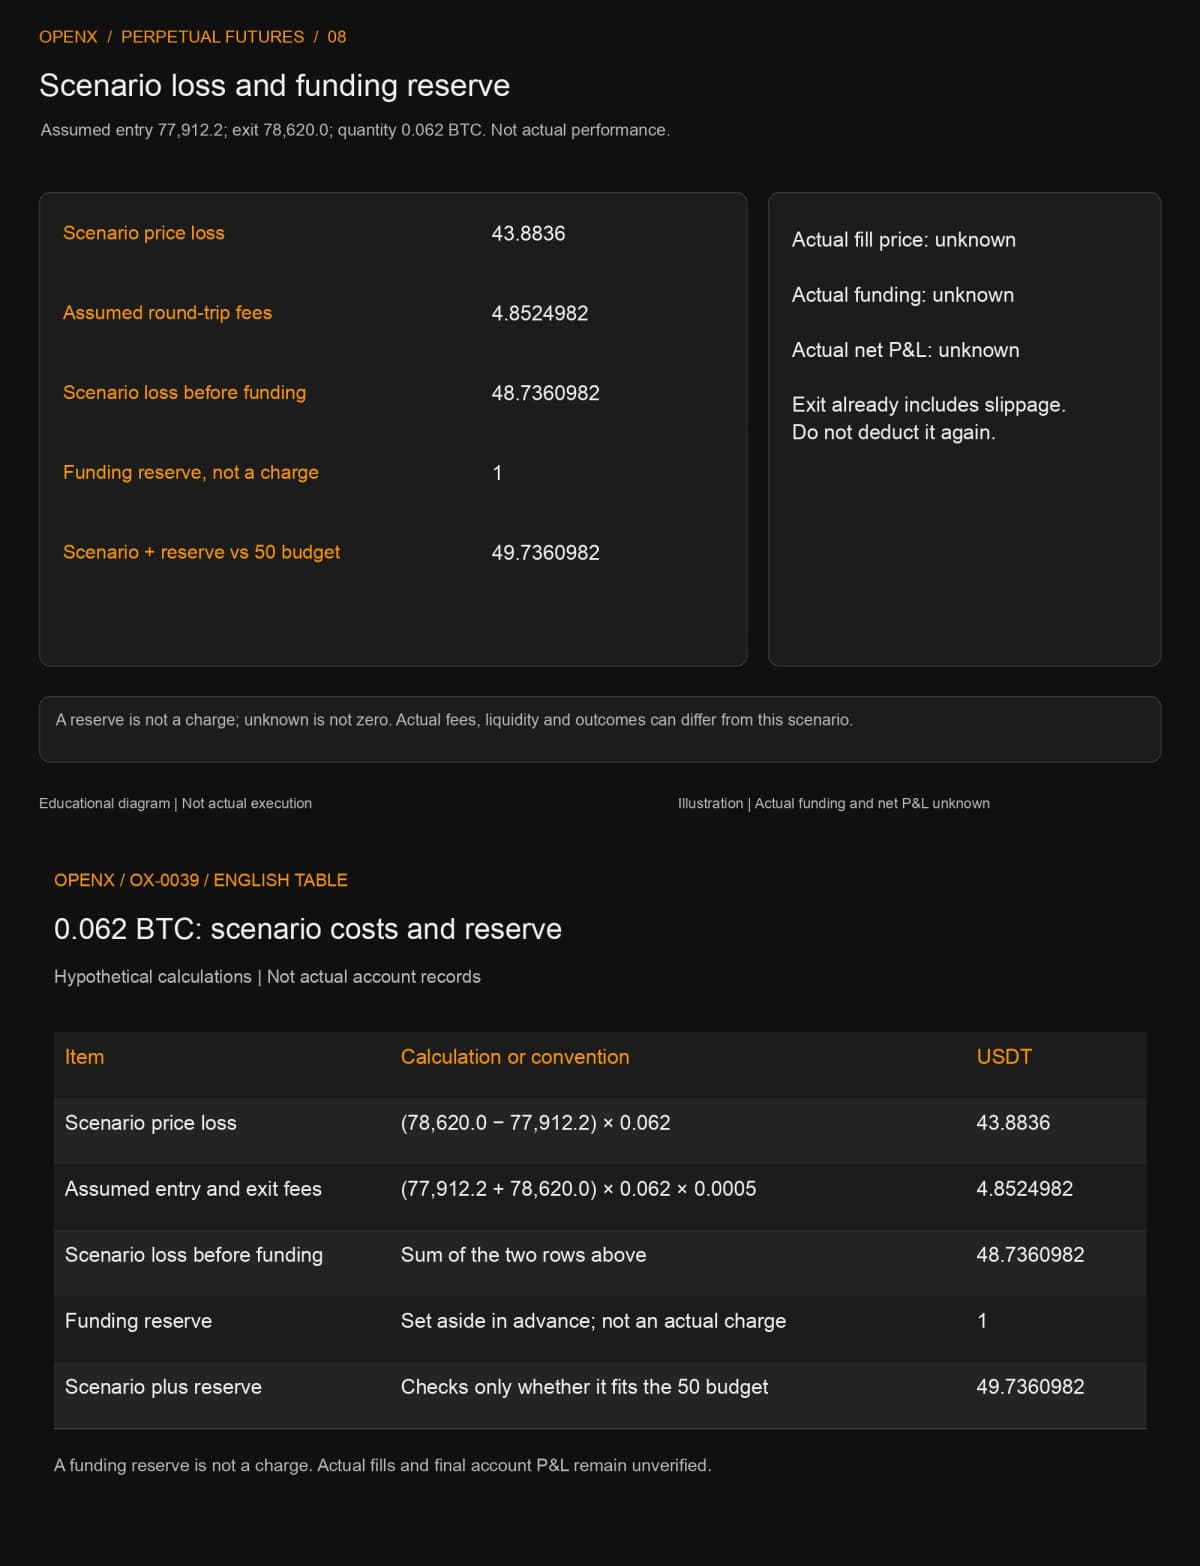
Use the new illustrative inputs: entry 77,912.2, exit 78,620.0 and quantity 0.062. Calculate the price loss, then fees on both sides. Every row below is an assumption or budget calculation, not verified live P&L.
| Item | Calculation or convention | USDT |
|---|---|---|
| Scenario price loss | (78,620.0 − 77,912.2) × 0.062 | 43.8836 |
| Assumed entry and exit fees | (77,912.2 + 78,620.0) × 0.062 × 0.0005 | 4.8524982 |
| Scenario loss before funding | Sum of the two rows above | 48.7360982 |
| Funding reserve | Set aside in advance; not an actual charge | 1 |
| Scenario plus reserve | Checks only whether it fits the 50 budget | 49.7360982 |
Slippage is already included in the 78,620.0 exit price; do not subtract the same 20 USDT per BTC again. Nor can the funding reserve become an actual fee automatically. Without account records, leave actual fill prices, funding and net P&L blank. Use the trading journal guide to connect these fields into a traceable record.
Save this calculation as a separate version and retain the original 0.072 BTC record. A new quantity should not overwrite the old worksheet. Keeping both explains why one historical sequence produced two calculations.
The exercise produces a plan with consistent cost definitions. Larger real slippage, different fee rates or funding beyond the reserve can still push the result above 50. A budget supports adjustment and cancellation; it does not make the market fill according to a spreadsheet.
What to check before and after the calculation
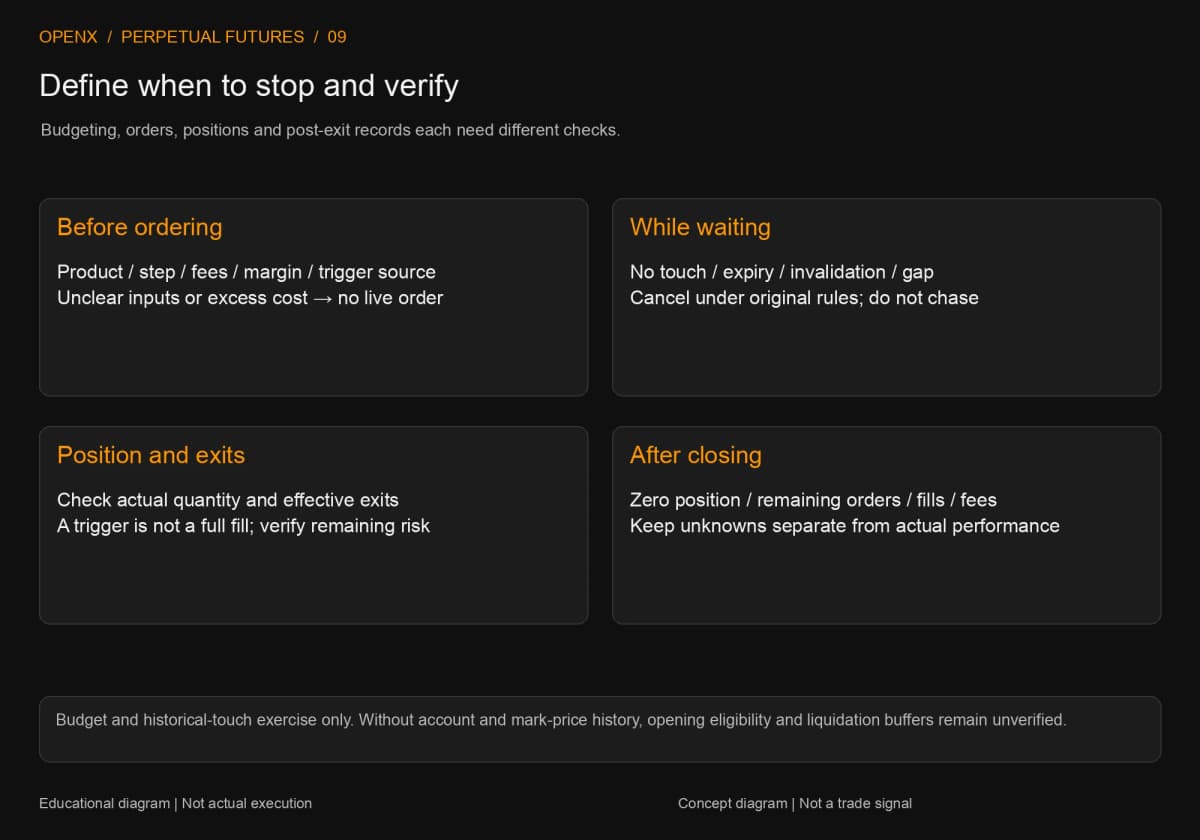
A quantity calculation still needs product specifications, account state and exit checks before live execution. Fix the allowed fee and cost scenarios before practicing. If fees, expected funding or available funds change while waiting, recalculate. Cancel if the plan no longer fits the budget rather than increasing leverage to preserve the original quantity.
After entry, check the actual quantity, valid exit orders and risk indicators. During price jumps, market exits may slip and limit exits may remain unfilled. A partial exit leaves exposure. Once fully out, confirm a zero position and check for uncancelled entry or exit orders. This requires account records, not an on-screen submission-success message.
This example does not compare strategy performance or establish which leverage or margin mode suits you. Prices, margin, exchange rules and stablecoins each carry risks. One historical example explains a process; it cannot establish a win rate or guaranteed loss limit.
Where to go next
Repeat the calculation first. Check that you can distinguish quantity, notional value, margin and a cost-inclusive budget, then choose the topic you need to explore. The six related guides below continue that learning path.
- Futures Position Sizing: Stop Distance, Leverage and Margin.
- Isolated vs Cross Margin: Capital, Top-Ups and Position Risk.
- Futures Liquidation: Mark Price, Margin and Stop-Loss Orders.
- Funding Rates: Settlement Times, Payment Direction and Costs.
- Futures Take-Profit and Stop-Loss: Triggers, Fills and Reduce-Only.
- Futures Trading Costs: Fees, Slippage and Net P&L.
This article is for learning product mechanics and working through historical examples, not investment advice. It does not verify real orders, fills or account risk. Live trading can lose principal, and fees, slippage and liquidation may produce outcomes beyond the plan.