Futures liquidation is platform intervention that can forcibly reduce or close positions when a position or account no longer meets maintenance requirements. It need not wait until margin reaches zero. A stop loss follows a separate order process: the wrong trigger price source or an unfilled triggered order may leave exposure open. Check the product, mode, mark price and effective exits, then reconstruct events from account and execution records. Without risk snapshots or fills, one candle cannot establish the cause. Preserve disputed records for the platform to investigate.
“The chart never reached my stop, so why is my position gone?” It is tempting to compare two lines immediately. First, though, ask which price the chart displays, which price triggers the stop, and how the platform measures account risk.
We will separate those questions, then follow a two-price teaching ledger to identify what each event shows and what remains unknown. A few candles cannot reveal a real account's liquidation price. The goal is a reproducible checking process that distinguishes “not triggered,” “triggered but unfilled” and “liquidated.”
Key takeaways
- Liquidation, a price stop and margin reaching zero are different events, not interchangeable lines.
- Read a risk ratio's numerator and denominator. Even two 100% thresholds can worsen in opposite directions.
- Prices establish price conditions. Actual liquidation and losses also require account and fill records.
Liquidation checks account risk; a stop follows an order process
Liquidation is platform risk handling; a stop is a trader's planned exit condition. The first does not pause because a stop exists. The second does not reduce a position merely because a price appears on screen. For the broader relationship between quantity, margin and exits, see the perpetual futures guide. The necessary concepts are explained here too.
Separate last traded price, index price and mark price
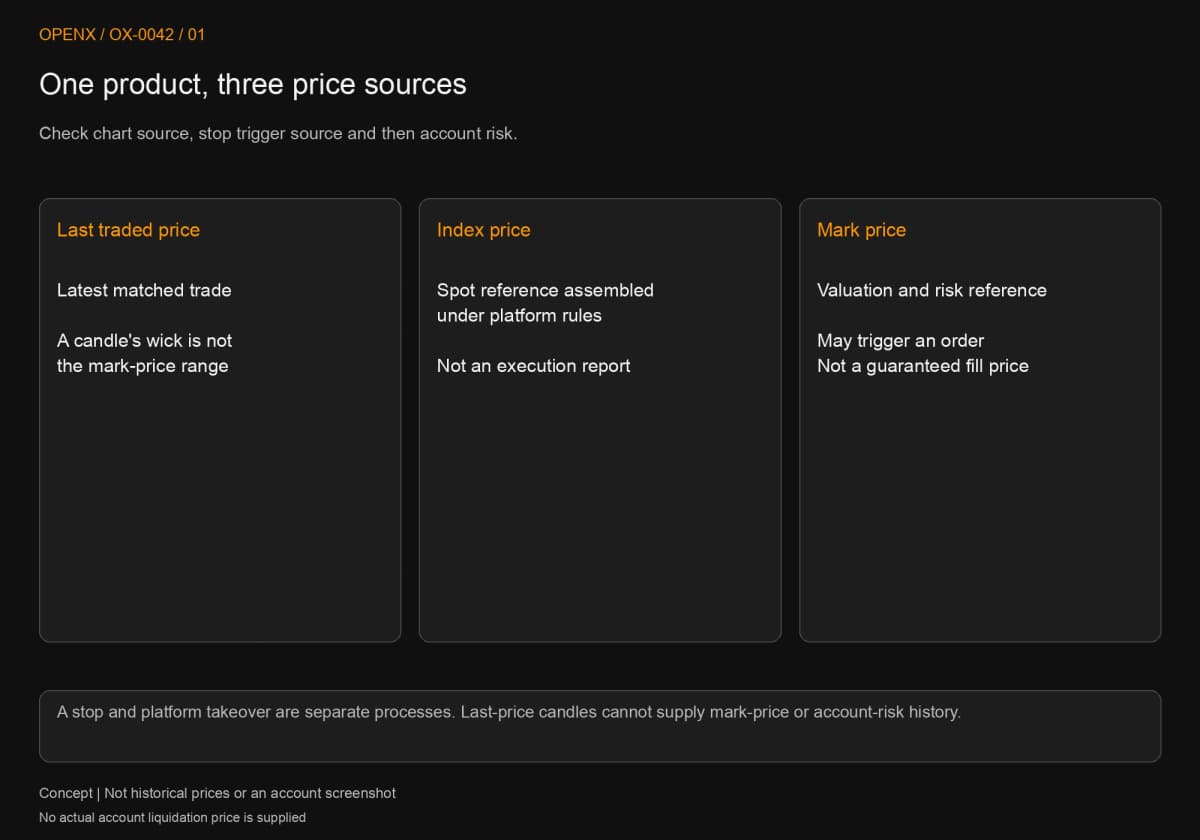
Last traded price is the contract's latest matched trade. Index price is a spot reference assembled under the platform's rules. Mark price is used to value positions and assess risk. They may be close without being the same data series. A last-price candle's wick is not automatically a mark-price high or low.
Binance's official Futures Liquidation Protocol describes mark price as a liquidation reference and distinguishes it from last price. This is why chart sources matter. If a stop uses last price while mark price reaches a risk condition first, the two processes can diverge in time. A mark-price trigger still does not guarantee a fill at mark price; execution depends on available counterparties.
Initial margin is not an allowance you can lose entirely
The same Binance protocol explains supporting funds and maintenance requirements. Initial margin forms part of the capital needed to establish a position; maintenance margin is the minimum requirement for keeping it. Insufficient supporting equity may start risk handling before all funds are exhausted. “Entry price moves against me by the reciprocal of leverage” is only a crude intuition, not a valid liquidation-price calculation.
Reconstruction also requires the product formula, quantity, mode, risk tier, fees and contemporaneous fund movements. More decimal places cannot repair missing inputs. Keep the trigger reference, the price used during platform handling and the final account statement separate rather than labeling all three as one fill price.
Why two 100% risk ratios can move in opposite directions
A percentage without its numerator and denominator cannot be compared across platforms. Similar names can describe ratios that become more dangerous as one rises and the other falls. Identify the applicable formula before asking how far away the threshold is.
Check the formula before interpreting direction
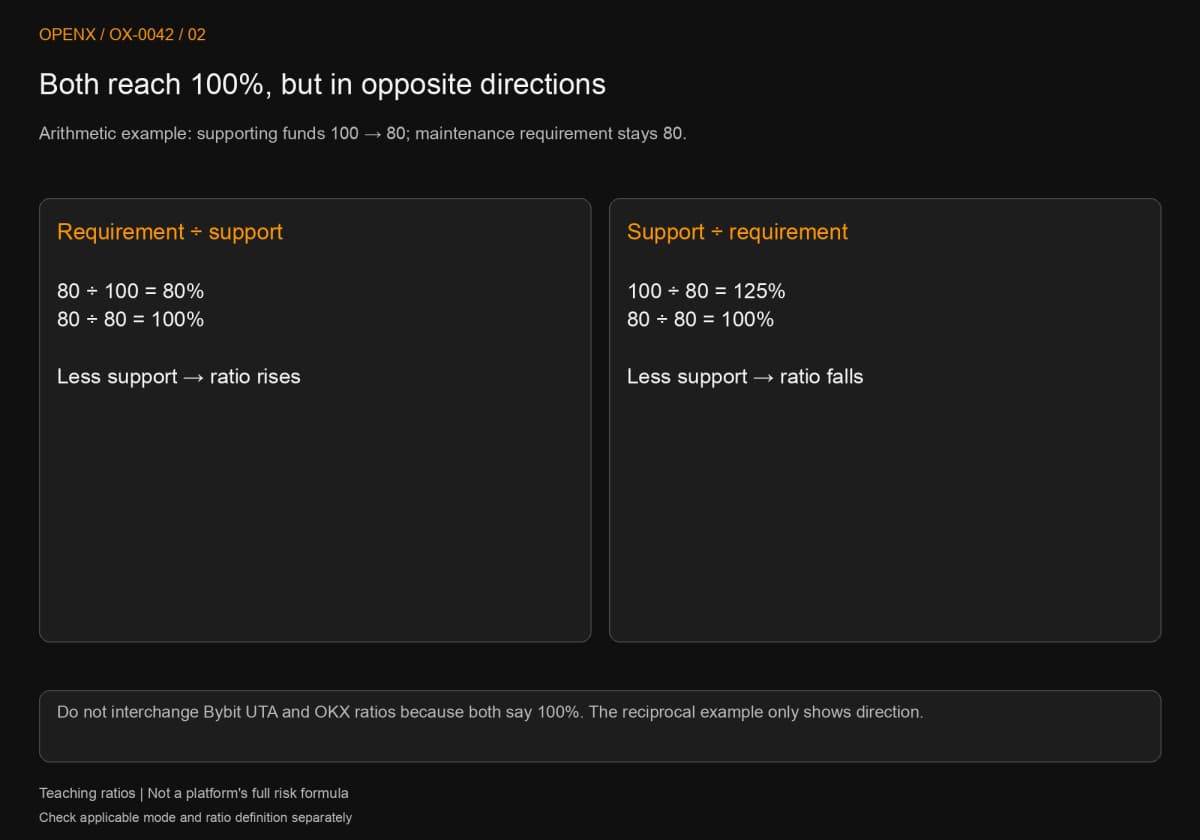
Bybit's FAQ — Order Execution and Liquidation, dated September 25, 2026, states a 100% account maintenance margin rate, or MMR, threshold for cross margin in its Unified Trading Account (UTA). For isolated margin, it describes mark price reaching a position's liquidation price. OKX's How Is the Futures Liquidation Price Calculated?, dated August 11, 2026, uses a maintenance margin ratio at or below 100%, subject to account applicability. Copying “100%” without definitions and modes loses the meaning.
A simple arithmetic comparison shows the difference. Suppose supporting funds are 100 and maintenance requirements are 80. Requirements divided by support gives 80%; support divided by requirements gives 125%. If support falls to 80, both reach 100%, but one rises and the other falls. These reciprocal teaching formulas are not any platform's complete risk engine and cannot calculate an actual account's risk ratio.
A cross-margin reference price is not a fixed protective boundary
Other positions, funds and collateral can change cross-margin risk together. Bybit's cited FAQ calls the displayed cross-margin liquidation price a reference; account MMR governs actual handling. Do not keep applying a screenshot taken at entry as though nothing can change. Isolated vs cross margin explains which funds support which positions.
A screenshot of one trading pair without contemporaneous account data reconstructs only part of the market state. Cross margin can be investigated, but the missing account state cannot be supplied by the wick of a last-price candle.
Two-price example: the risk reference is crossed before the stop condition
Compare last traded price and mark price at the same times to see why a stop condition may arrive later. Every price, time, position and risk reference below is hypothetical. None is a historical market or live-account record. Fix the position and rules before reading the events; the example does not prove a liquidation occurred.
Step 1: fix the position, price source and unknown fields
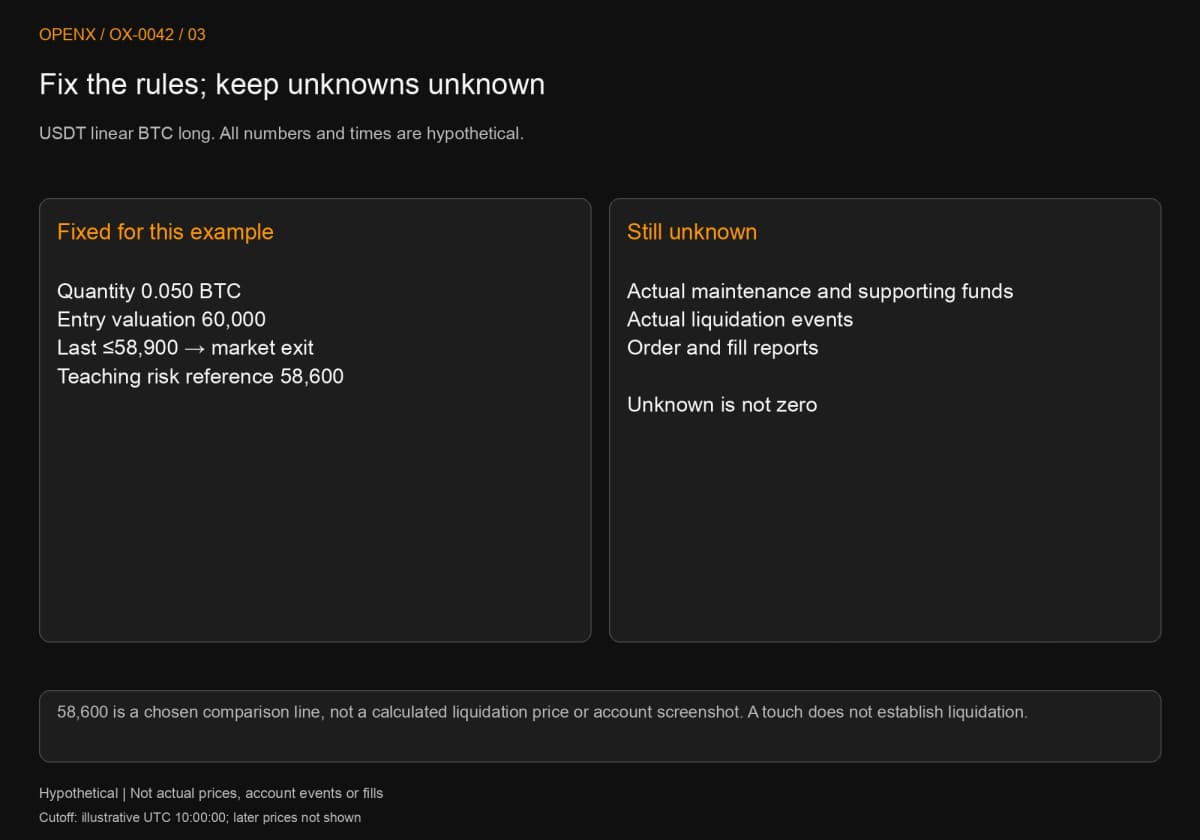
Assume a 0.050 BTC long in a USDT linear perpetual, entered at 60,000 USDT. Falling prices produce negative price profit and loss (P&L). BTC means bitcoin; USDT is the quote and settlement asset. The illustrative clock uses Coordinated Universal Time (UTC), not a particular market date. At 10:00:00, set both last and mark prices to 60,000.
The original stop condition is “start a market exit when last price is at or below 58,900.” Add a separate teaching risk reference of 58,600 to show how mark price can cross a different line first. This is not a liquidation price calculated from a platform formula, and no account screenshot substantiates it. Crossing it records only “reference reached,” not a liquidation fill.
The table contains snapshots, not the paths between them. To establish actual isolated liquidation, we would need the account, product, mode and effective liquidation condition at that time, plus platform events. Cross margin also needs account-risk data. These are absent, so we can compare only when the two prices meet specified conditions.
Step 2: the same timestamp can give different answers
At each row, first test the last-price stop condition, then whether mark price has crossed the teaching reference. Do not choose whichever price makes the outcome look preferable.
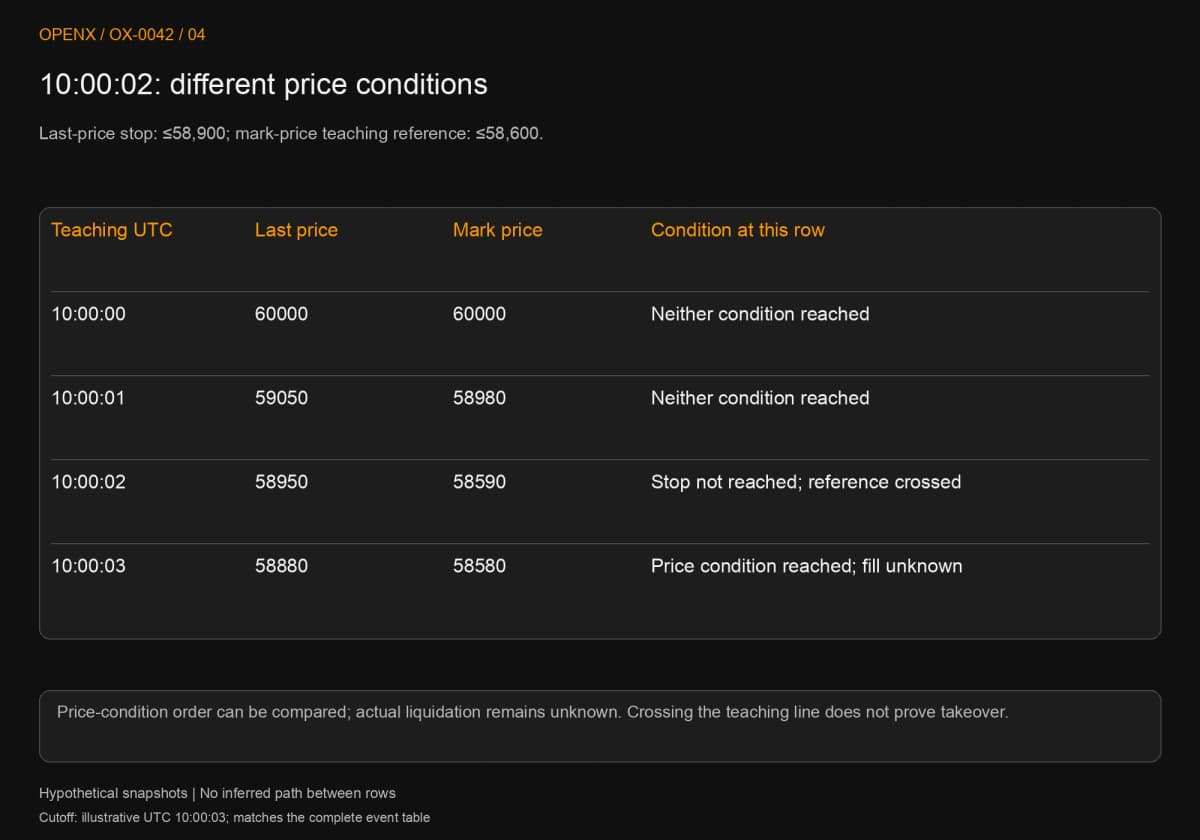
| Illustrative UTC time | Last traded price | Mark price | What this row establishes |
|---|---|---|---|
| 10:00:00 | 60,000 | 60,000 | Neither price condition reached |
| 10:00:01 | 59,050 | 58,980 | Last above 58,900; mark above 58,600 |
| 10:00:02 | 58,950 | 58,590 | Stop price condition not reached; mark below teaching reference |
| 10:00:03 | 58,880 | 58,580 | Last-price stop condition reached; fill unknown |
At 10:00:02, last price remains 58,950, above 58,900, so the stop condition is unmet. Mark price is already 58,590, below 58,600. Both observations can be correct. The example shows how different price sources can reach conditions in a different order; it supplies no evidence of a platform liquidation event.
Looking only at last price, the stop seems another 50 away. Treating 58,600 as a guaranteed safety line could reinforce a mistaken sense of time remaining. Keep chart price, condition price and risk data in separate fields, preserving the contemporaneous version. A later reference update must not rewrite the 10:00:02 judgment.
Step 3: reaching the stop price still does not prove a fill
At 10:00:03, 58,880 is below 58,900, satisfying the teaching price condition. But there is no server trigger report, order acceptance or execution record. The defensible status is “price condition reached.” The row does not even prove a real market order entered the market, let alone an average exit of 58,900.
If later records show a trigger with zero filled quantity, record “triggered, unfilled.” If part fills, reduce quantity only by the reported fill. A liquidation event needs its own takeover time and handled quantity, followed by a check of remaining exit orders. These are possible evidence-based branches, not events established here. Without reports, stop the ledger rather than invent a successful exit.
This boundary matters. Recording “closed” when only a condition was met makes every subsequent calculation assume zero exposure. A partial exit or a failed submission would leave risk hidden by the record.
Step 4: calculate price changes and investigate liquidation separately
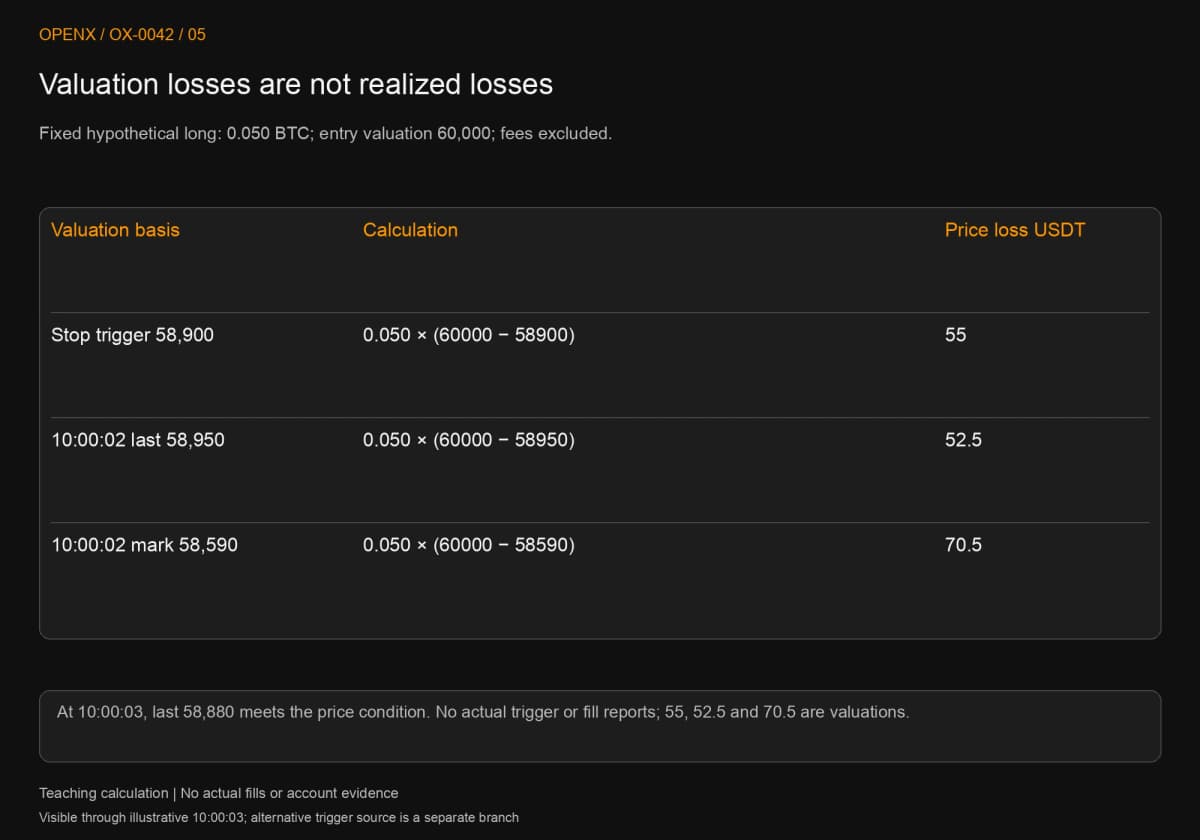
At 0.050 BTC, the planned difference from 60,000 to 58,900 is a 55 USDT loss. That values the position temporarily at the trigger price; it does not cap the actual loss. At 10:00:02, valuation at last price, 58,950, gives a 52.5 loss. Valuation at the same row's mark price, 58,590, gives a 70.5 loss. Both use different price sources, and neither is realized execution P&L.
“Last-price loss is still below the planned 55” and “mark-price loss is already 70.5” are therefore compatible. Whether the platform must act depends on effective supporting funds and maintenance requirements. The 70.5 alone reveals neither remaining margin nor a confirmed liquidation. Leave missing account inputs open for investigation.
For an independent comparison, keep all events unchanged but make mark price the hypothetical stop source. At 10:00:02, 58,590 is below 58,900, so this branch reaches its price condition earlier. It still lacks order acceptance and fills, so it cannot establish an escape from liquidation. Do not overwrite the original last-price plan with this alternative. Changing one input at a time reveals the cause of the difference.
If a record claims an exit between snapshots, check fill identifiers, times, quantities and prices, not merely a smaller P&L figure. Here, actual trade count and executed volume are unknown, not zero.
Reproduce the table row by row. Alternative exercises can change trigger source, omit a required price or introduce duplicate times. Missing necessary fields mean “needs evidence,” not invented account performance. Keep price source, trigger status and missing evidence together so the next investigation step is clear.
Investigate liquidation disputes through events
Rebuild one timeline, then compare the settings effective at each event. A final screenshot may contain later quantities, risk prices or balances. Event identifiers and server times are generally easier to align with platform support than manually drawn lines.
Preserve account and order state alongside price sources
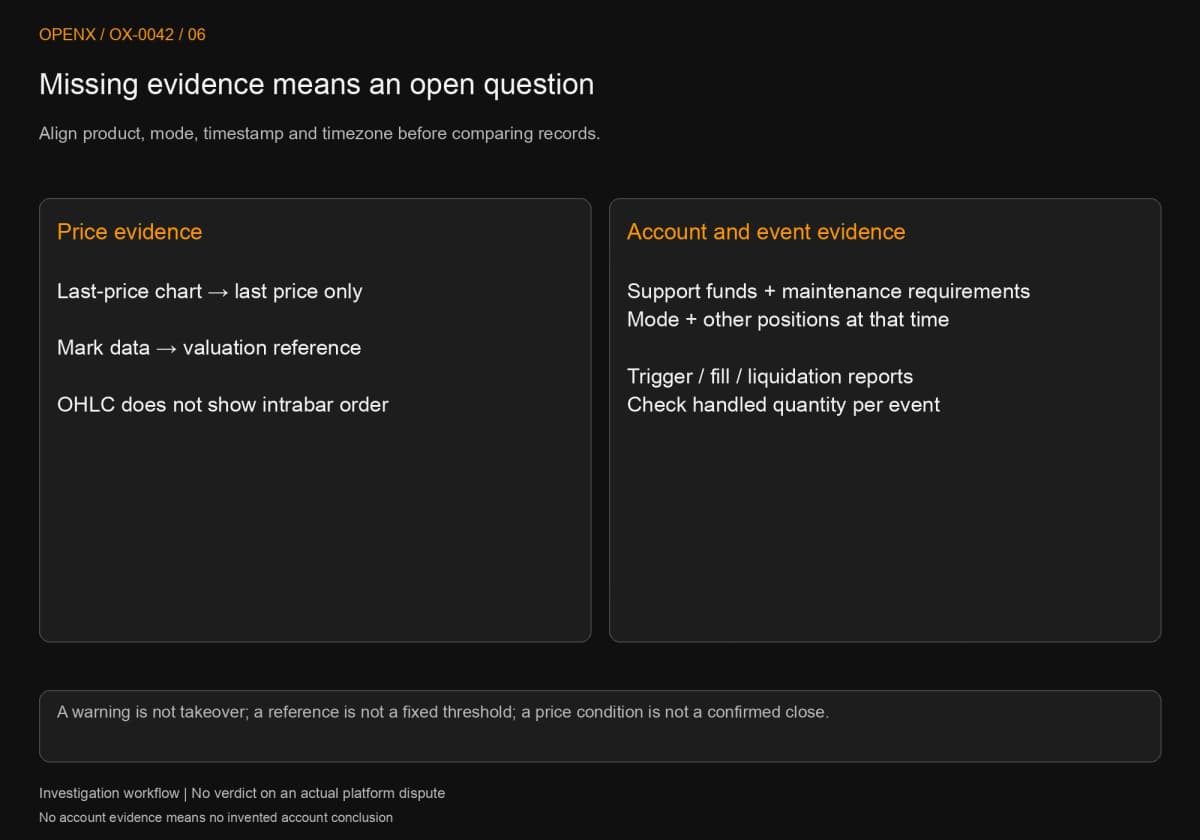
Record the full product name, account mode, direction and quantity, plus price source and timezone. For orders, preserve trigger source and price, order type, status changes, filled quantity and average price. For the account, retain supporting funds, maintenance requirements, transfers, fees and related positions. The comparison must use matching times, not arbitrary screenshots.
The cited OKX liquidation page also distinguishes cancellation, reduction and liquidation stages. Do not assume all quantity closes instantly. Track actual reductions, remaining size and fees to their reports. Product and regional scope vary; another platform's sequence is not a verdict on a dispute.
Leave unsupported conclusions unresolved
Last-price candles alone leave the mark-price path unknown. Mark price alone leaves the account threshold unknown. A risk warning alone does not establish takeover or final execution. When one OHLC candle contains several levels, its open, high, low and close do not establish their intrabar order. Finer data or event reports are needed.
Naming missing evidence helps the investigation. It prevents a hypothesis from becoming “confirmed platform error” through repeated retelling.
Reduce liquidation risk through the controls you actually have
You can plan exposure, funding and exits; you cannot guarantee every exit's speed or price. A liquidation price should not substitute for your stop. Repeatedly transferring money in response to rising risk also needs a renewed limit on total funds you are prepared to commit.
Reducing quantity, adding margin and changing leverage differ
For the same price movement, lower quantity reduces the absolute linear price P&L. More margin changes supporting funds without undoing losses. Leverage changes affect margin and platform conditions; a smaller multiplier is not proof of safety. Use futures position sizing to check quantity and budget, then examine this account's actual risk state.
Next steps: make the plan verifiable
Use the trading journal fields and templates to separate plans, orders and fills. Futures take-profit and stop-loss orders develops exit execution. Funding rates, settlement and holding costs covers settlements while the position remains open.
This article teaches risk identification, not investment advice. Its illustrative numbers do not represent actual prices, accounts or fills. Leveraged contracts involve liquidation, slippage, system and asset risks. One example establishes neither strategy performance nor a maximum loss.