A funding rate is the percentage used for periodic payments between perpetual long and short holders. Under the USDT-settled linear mechanism described in Binance's Introduction to Futures Funding Rates, positive rates mean longs pay shorts; negative rates reverse the direction. Multiply settlement position value by the rate to estimate the payment. Historical rates are not your account statement: eligibility, quantity and actual cash flows still need checking.
A funding rate of 0.003% looks small. Two days later, you open the account statement and wonder whether to multiply it by entry price, current price or margin. Meanwhile, the rate has not stayed at 0.003% for those two days.
We will separate percentage, payment amount and settlement time, then calculate six fixed historical events for Binance BTCUSDT, bitcoin quoted against the USDT stablecoin. The position is hypothetical; rates and corresponding mark prices come from historical records. Keeping them separate prevents a model from becoming a claimed real trade. The aim is to understand both the calculation and which missing input could explain a statement difference.
Key takeaways
- The rate is a percentage; the funding payment is an amount. Margin alone is not the calculation base.
- Frequency and settlement times depend on the product. Eight-hour funding is not a universal rule.
- Calculate each event with its own price, rate and quantity. Estimates and actual payments stay separate.
Funding rates set direction; funding payments are amounts
The rate tells you the payment direction and percentage; the payment tells you the amount for that event. Binance's introduction describes funding as a mechanism to narrow divergence between contract and spot-reference prices. It does not guarantee future price convergence. The perpetual futures guide introduces perpetuals, positions and margin.
Rate signs and statement signs are different conventions
A long has positive price P&L when price rises; a short has positive price P&L when it falls, before costs. For the linear perpetual mechanism here, Binance's introduction says positive funding means longs pay shorts, while negative funding reverses that. A positive rate alone does not prove your account is charged: first establish direction and whether your position qualified for that event. A zero rate gives a zero amount under this simplified formula; missing data does not.
Statements may use different signs. A cost field might show an expense as positive; a cash-flow field might show the same debit as negative. Here, model payments are positive for paying and negative for receiving. Cash flow has the opposite sign. That is our ledger convention, not a universal platform format. Read the field definition before reconciliation.
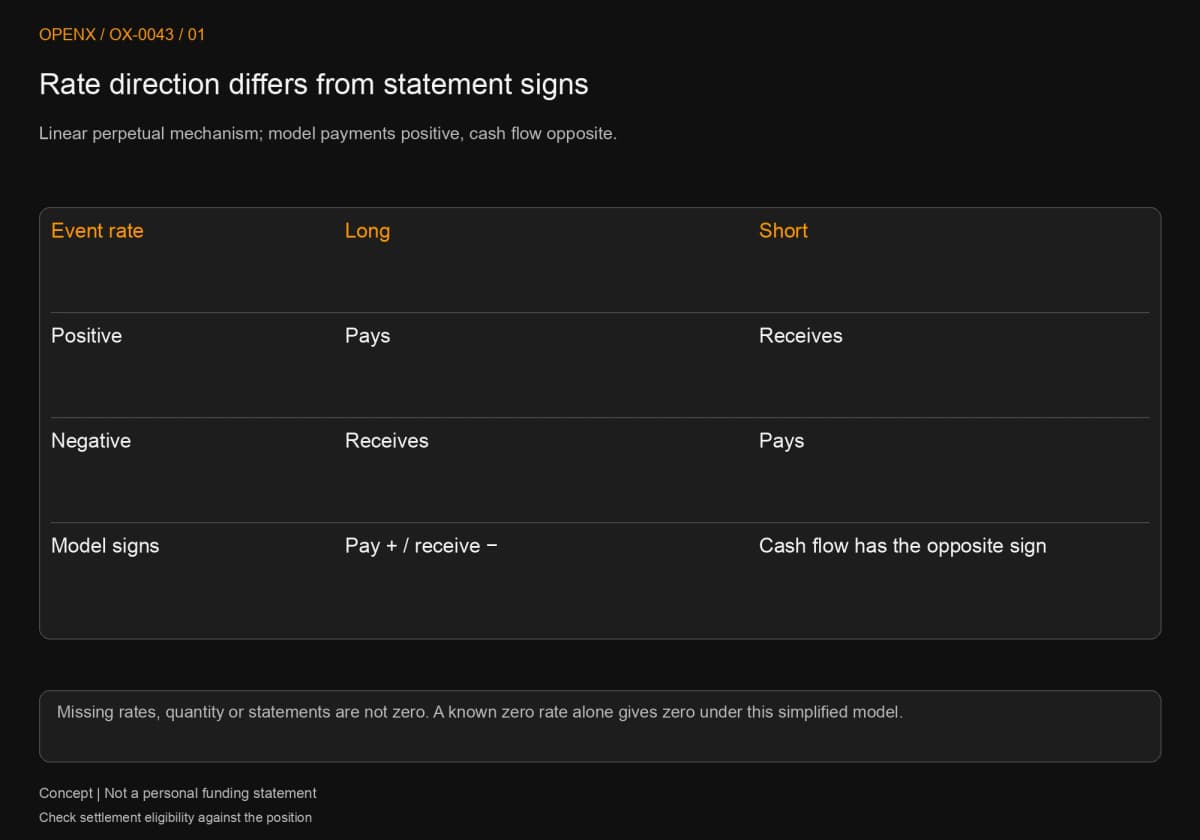
Use settlement position value, not margin
For this BTC-quantity, USDT-settled linear contract, position value is quantity multiplied by the corresponding mark price at settlement. Mark price is the platform's valuation and risk reference, distinct from the last matched trade. Multiply that by the event's funding rate. Binance's Introduction to Futures Funding Rates, dated March 6, 2026, gives both formulas. Do not apply this BTC-times-price form directly to coin-margined inverse contracts.
For an illustrative 1,000 USDT position value at a positive 0.01% rate, a long pays 0.1 USDT. Depositing only 100 USDT of margin does not make the calculation 100 × the rate, or 0.01 USDT. Exposure and committed capital differ. At the same quantity and settlement price, changing leverage alone does not multiply funding; increasing quantity does.
Check the product's settlement schedule
Confirm the event's schedule, then whether your position participated. Hours held do not automatically equal a number of funding events: the position may span a settlement or close between events. Dates and timezones matter; “eight in the morning” is incomplete.
Check the applicable interval and boundary rules
Bybit's Funding Fee Calculation, dated May 12, 2026, says trading pairs can have different intervals, frequency may change under specified conditions, and eligibility for opens or closes within seconds of settlement is not guaranteed. Binance's introduction notes a possible 15-second variation in actual charging time. Each statement has its own scope. Another exchange's timing note is not a guaranteed free-exit window.
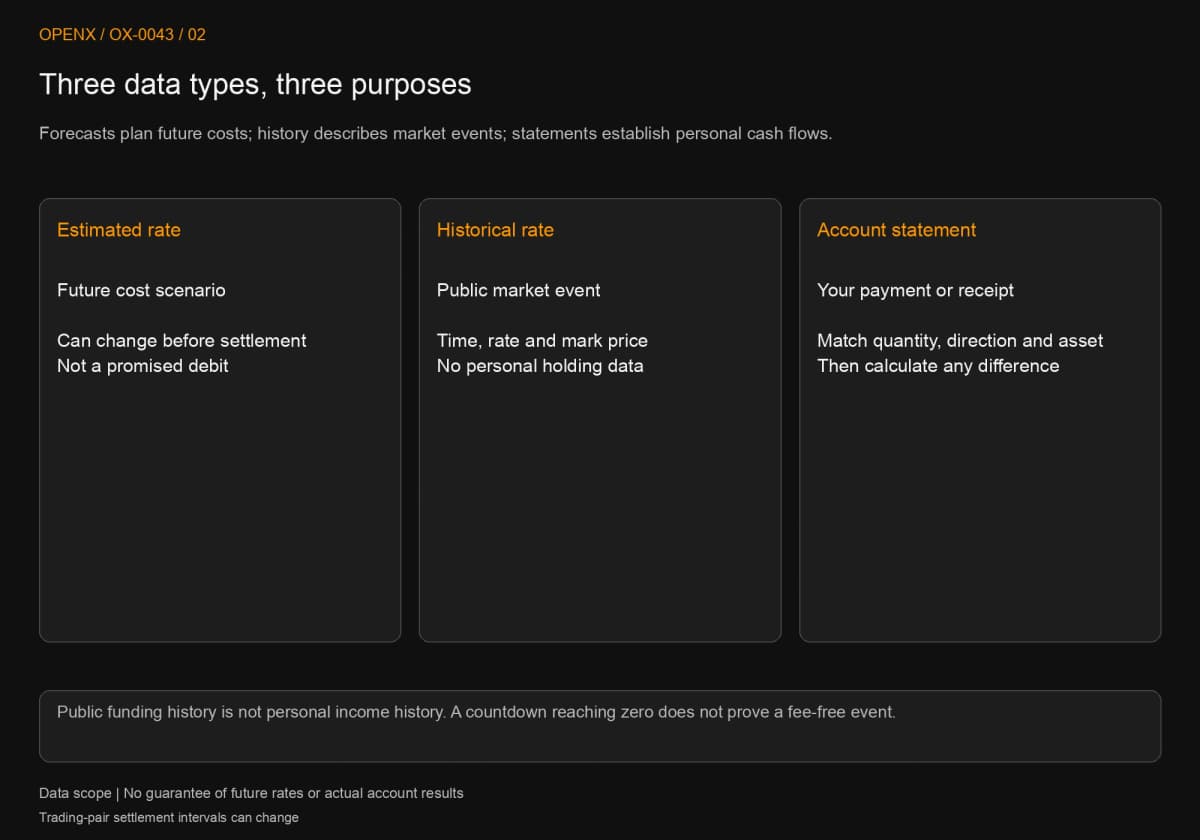
Save the next settlement shown at the time, the product specifications, your server-side fill times and the account statement. A countdown reaching zero does not establish that no charge occurred. Our example assumes holding from one hour before the first event until one hour after the last. Fills close to settlement still need actual eligibility checked against the statement.
Forecasts, historical rates and account entries answer different questions
An estimated rate supports a future cost scenario and can change before settlement. A historical rate describes a public value for one product and event. An account entry records what you paid or received. Complete public history still cannot establish personal fees without quantity and holding status.
Binance's Get Funding Rate History provides settlement time, rate and the mark price corresponding to that event. These support the public inputs to the formula. Personal cash flows still require matching position quantities and account records.
Six historical BTC events: calculate each one separately
Use six actual historical rates and mark prices with one hypothetical position. Recalculate each event, then add the amounts. Public data are not a personal statement, and the model amounts below are not observed debits.
Step 1: fix the window and hypothetical holding
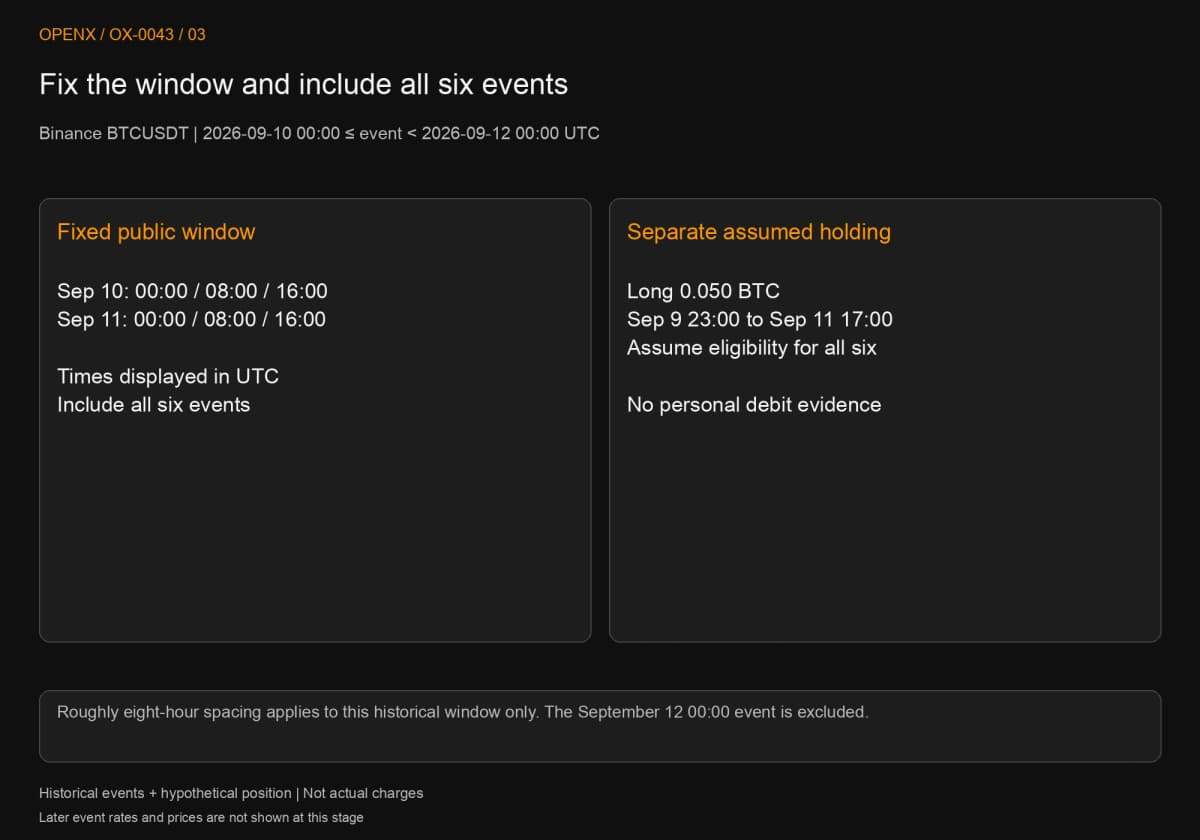
The product is Binance BTCUSDT USDT linear perpetual: BTC is bitcoin and USDT is the quote and settlement stablecoin. Use UTC and include every settlement from September 10, 2026 at 00:00 up to, but excluding, September 12 at 00:00. Add eight hours for Taiwan time, changing the date when necessary.
Assume a constant 0.050 BTC long from September 9 at 23:00 through September 11 at 17:00, with no size changes and eligibility for all six events. This is not a fill record or evidence of obtainable entry and exit prices. We calculate funding only, not price profit.
The events are September 10 at 00:00, 08:00 and 16:00, then September 11 at those same three times. The table displays minute-level timestamps. Roughly eight-hour spacing describes this product and window only; future reconciliation starts with the applicable schedule again.
Step 2: check the first event's units and direction
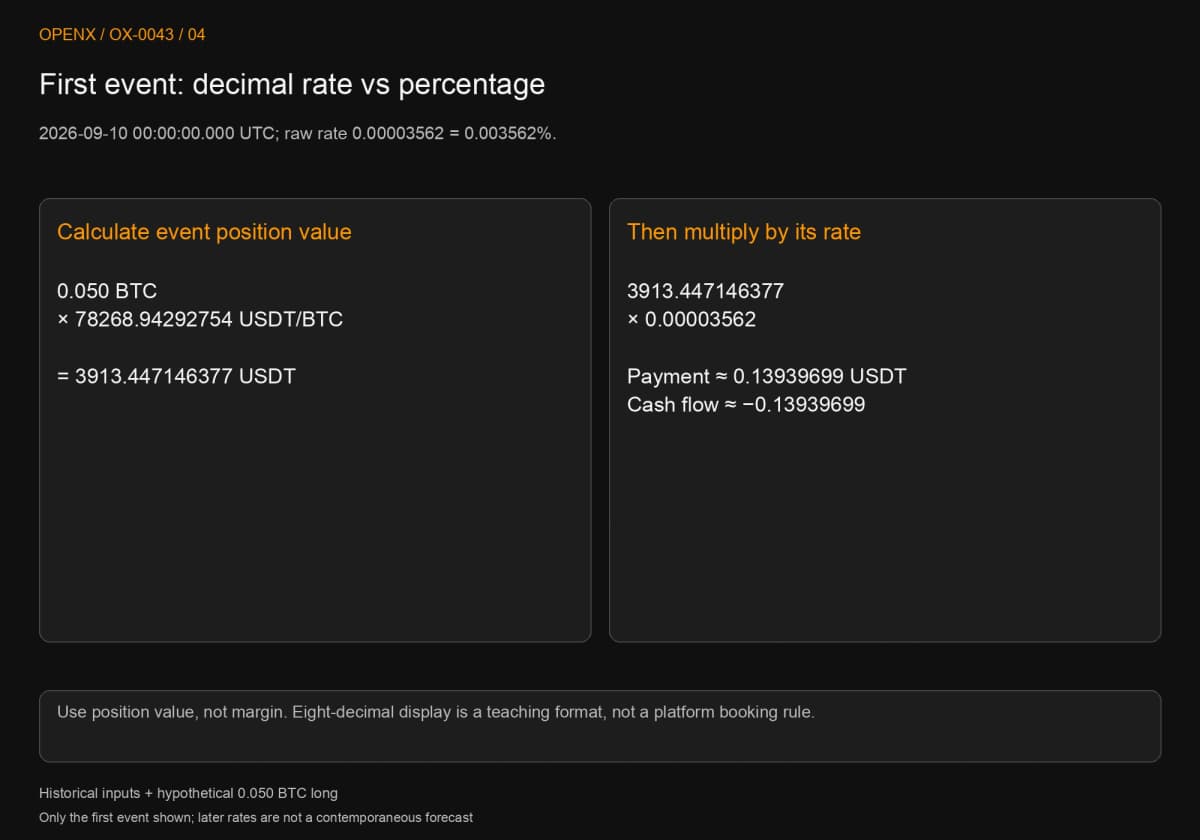
The first raw rate is 0.00003562 in decimal form, equivalent to 0.003562%, not 0.03562%. Its corresponding mark price is 78,268.94292754 USDT/BTC. At the assumed 0.050 BTC, position value is 3,913.447146377 USDT. Multiply by 0.00003562 to get a payment of 0.13939698735394874 USDT.
The hypothetical position is long and the rate positive, so model payment is positive and cash flow negative. Displayed to eight decimal places, payment is 0.13939699. Actual asset precision and booking rules still need reconciliation; the platform need not display eight decimals. Check this conversion and sign before copying a percentage mistake into six rows.
Step 3: use each event's own price and rate
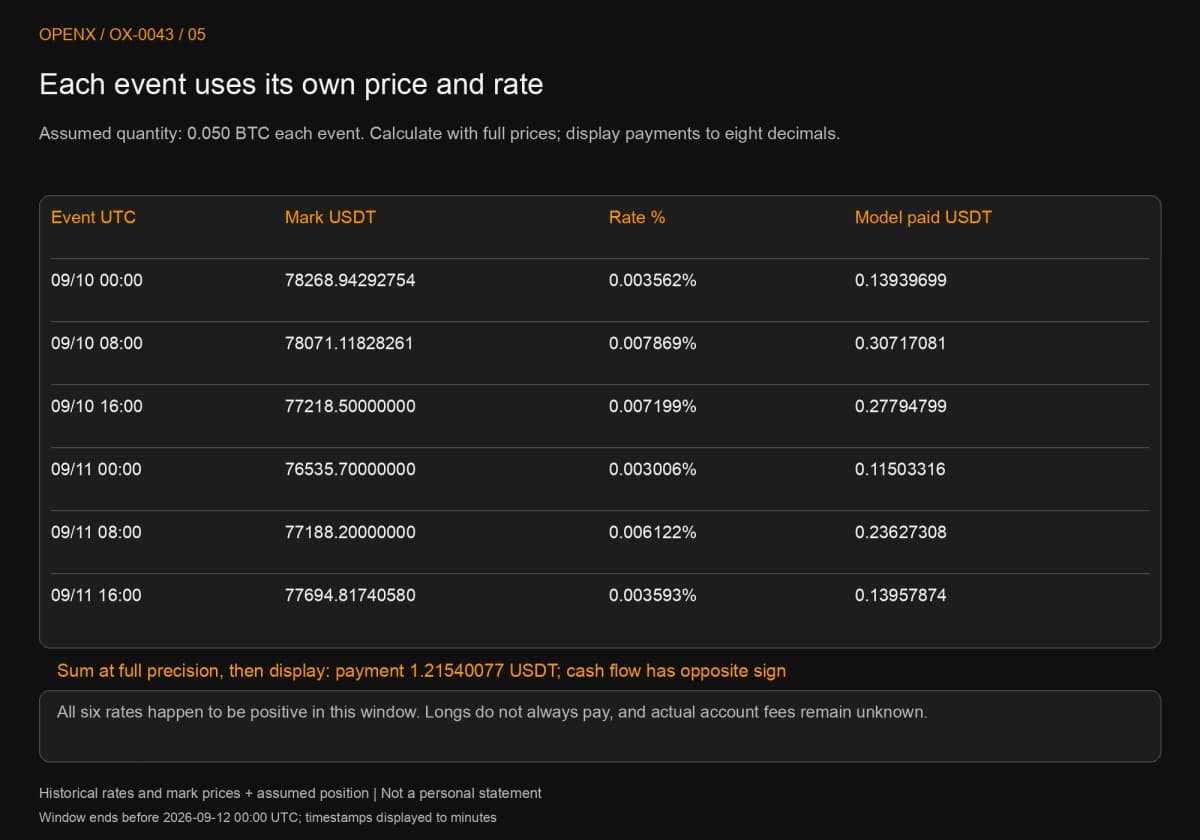
Prices below retain full source precision. Payments display eight decimals, but calculations use full prices and rates before the total is rounded for display. The 0.050 BTC in every calculation is a teaching assumption, not a personal position obtained from a public endpoint.
| Settlement, UTC | Mark price, USDT | Funding rate | Model payment, USDT |
|---|---|---|---|
| Sep 10 00:00 | 78268.94292754 | 0.003562% | 0.13939699 |
| Sep 10 08:00 | 78071.11828261 | 0.007869% | 0.30717081 |
| Sep 10 16:00 | 77218.50000000 | 0.007199% | 0.27794799 |
| Sep 11 00:00 | 76535.70000000 | 0.003006% | 0.11503316 |
| Sep 11 08:00 | 77188.20000000 | 0.006122% | 0.23627308 |
| Sep 11 16:00 | 77694.81740580 | 0.003593% | 0.13957874 |
If amounts are verified equal across events, multiplying one amount by the count is valid. Do not assume equality before checking. The second rate is higher than the first; despite a slightly lower mark price, payment rises to about 0.30717081. The fourth event has another price and rate, producing about 0.11503316. Constant quantity does not mean constant payments.
Adding without truncating each row first gives 1.215400769756397485 USDT. To eight decimals, that is 1.21540077, with model cash flow of −1.21540077. All six rates in this window are positive, so this constant long pays six times. That does not mean longs always pay.
Repeating the first 0.13939698735394874 six times gives about 0.83638192, not this window's total. The error replaces the next five prices and rates with the first event's inputs. Saving each original row makes the discrepancy traceable instead of suggesting an unexplained extra charge.
Step 4: recalculate size changes and omitted events
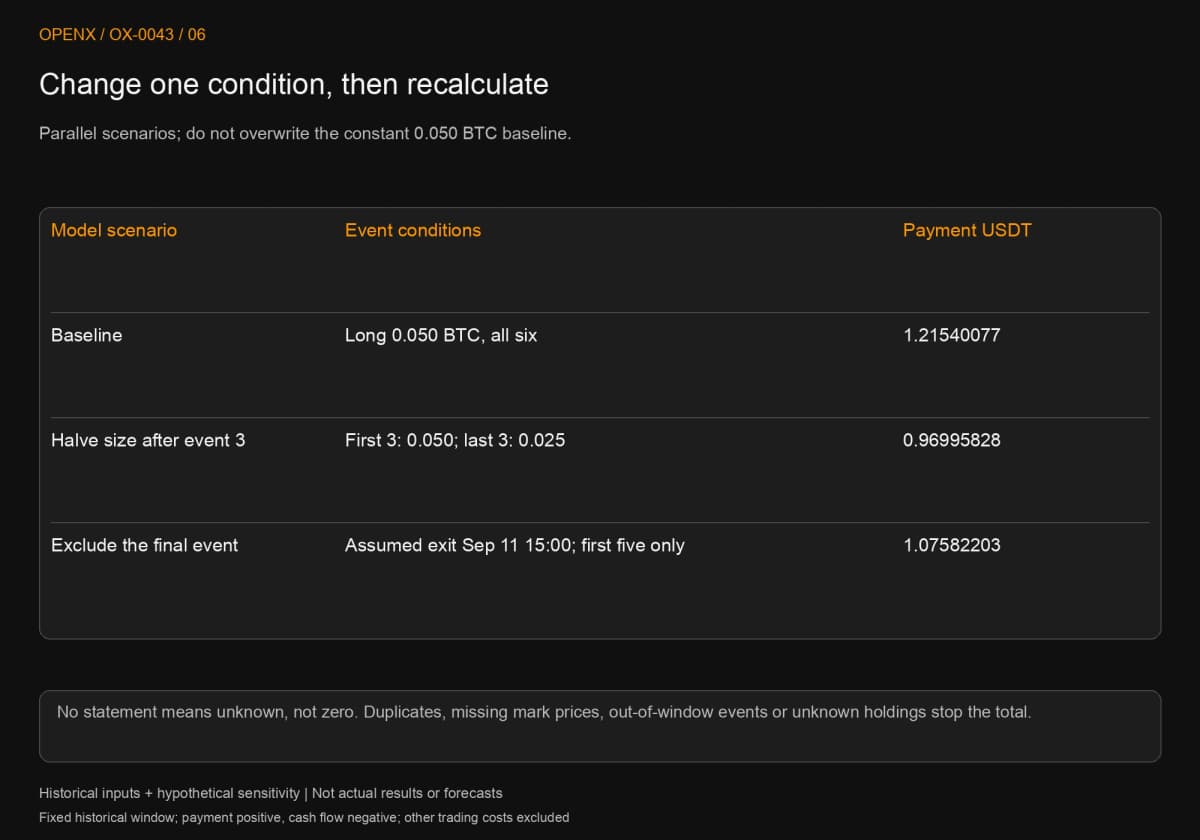
For an independent sensitivity scenario, retain 0.050 BTC for the first three events, then reduce to 0.025 after the third and before the fourth. Only the last three payments halve. Total model payment becomes about 0.96995828 USDT, not half of 1.21540077, because the first three still use the original quantity. This is a hypothetical alternative, not a claimed historical reduction.
In another independent scenario, assume a complete exit by 15:00 on September 11 and confirmed ineligibility for the final settlement. Include only the first five events: about 1.07582203 USDT. A click on “close” at 15:59 without a fill report is not enough to remove the final event.
For practice, hide all events after the first and calculate only its fee. Add the second row when its data becomes available. We know all six now because this is historical calculation. Their later rates were not available on September 10 at 00:00 as an exact two-day forecast. Pre-trade planning requires separately labeled rate scenarios, compared later with actual values.
A constant short using identical quantities, prices and rates reverses the sign. Model payment becomes −1.21540077 and cash flow positive. Equal absolute amounts follow from identical event inputs. Keep this as a separate short model and check the opposite signs. Do not flip a statement's signs twice or combine two hypothetical models into actual payments.
Enter rates with their % sign in a spreadsheet, or divide percentages by 100 before multiplying full mark prices and quantity. Separate model and account-fee columns. Without a statement, use “awaiting statement,” not zero. Before totaling, exclude duplicate events, missing prices and events outside the window. Complete public data cannot supply missing personal quantities or account charges.
Reconcile differences before alleging a fee error
A mismatch calls for checking inputs and sign conventions first. Public history establishes a market rate and corresponding price, while your size may have changed, filled partially or missed a settlement entirely.
A model payment is not an account debit
Match exchange, full product, asset, settlement event, direction and quantity, then statement signs and precision. Public BTCUSDT history cannot reconcile another exchange, a coin-margined BTCUSD product or another subaccount. Which funds pay the charge depends on the relevant margin rules and actual records; this example does not calculate liquidation risk.
Use the trading journal fields and templates to keep model and actual columns. Calculate a difference only when the actual event amount is available. Otherwise, “awaiting statement” prevents a spreadsheet blank from silently becoming a confirmed zero expense.
Stop totals when events are duplicated or inputs are missing
Overlapping downloads can count a settlement twice. Filling a missing mark price with entry price hides an error behind precise decimals. Deduplicate by product and event time; stop if price or rate is missing and obtain the original data. Missing personal quantity cannot be recovered from public rates.
Normalize timezones before matching. Reading 08:00 UTC as 08:00 local time may associate the wrong holding interval; dates also change across midnight. Preserve a full timestamp and timezone rather than just “charged at eight.”
Funding is a cost input, not a trade-direction signal
Receiving funding does not make the entire trade profitable. Price profit and loss (P&L), entry and exit fees, slippage and other adjustments can outweigh the receipt. Annualizing one rate is at most a constant-input scenario, not a promise of future returns.
Funding income can coexist with a trading loss
If a teaching example receives 0.1 USDT but loses 10 USDT on price, those two components total −9.9 before trading fees. Receiving funding does not remove directional risk, margin conditions or exit costs. Cross-exchange and spot hedges introduce other risks; this guide does not offer an arbitrage model.
Next steps: bring holding costs into the plan
Use futures position sizing to check reserves and capital constraints. Futures take-profit and stop-loss orders explains when an exit is actually complete. Futures trading costs connects the components to total cost.
This article teaches historical data and cost calculation, not investment advice. Historical rates do not forecast future rates. The position and payments are hypothetical, not actual fills or charges. Contracts, stablecoins and platforms all carry risks.