This SMC strategy guide is for readers who can already read candlesticks and want to practice analyzing price action. Start with market structure to set a directional view, use liquidity and price zones to identify where to watch, wait for lower-timeframe confirmation, then calculate the stop, target and position size. A worked example using real historical BTCUSDT data shows the full simulated trade, without counting a decline before entry as profit. Cancel when the setup becomes invalid or the waiting period expires; exit an open position when its stop is hit.
What Is SMC, and What Can It Help You Do?
SMC stands for Smart Money Concepts. Open a chart and you can draw zones almost anywhere. The harder question is which one is worth waiting for. SMC organizes price action into a sequence: establish where price is moving, identify places where orders may be concentrated, then decide what response would justify an entry.
For me, the useful part is turning “I want to go short” into conditions that can be checked. But a candle records only the open, high, low and close over a period; it cannot prove which institution is buying or selling. We will first establish what each concept does, then follow one stretch of price data through a complete trading decision. Every concept used in the charts is explained before we apply it.
Key takeaways
- Market structure sets the directional view. Liquidity and price zones help identify where to watch; touching a zone does not mean an order was filled.
- Write down confirmation, entry, invalidation and position sizing separately so you can check the sequence candle by candle.
- Historical prices can be verified, but simulated fills still depend on assumptions. One winning or losing trade cannot establish a strategy's win rate.
The Core SMC Concepts and What Each One Does
These concepts are not six independent trading signals. Structure helps establish direction; liquidity helps identify where to watch. Order blocks (OBs), fair value gaps (FVGs) and breaker blocks offer different candidate zones. Understanding their roles keeps you from treating three overlapping rectangles as three separate guarantees of profit.
Market Structure: Define How You Select Swing Points
Successively higher highs and higher pullback lows are typical of an uptrend. Falling highs and lows suggest a downtrend. If neither side is making progress, you can initially classify the market as ranging. Choose your timeframe first: a 15-minute rally may be only a small part of a four-hour decline.
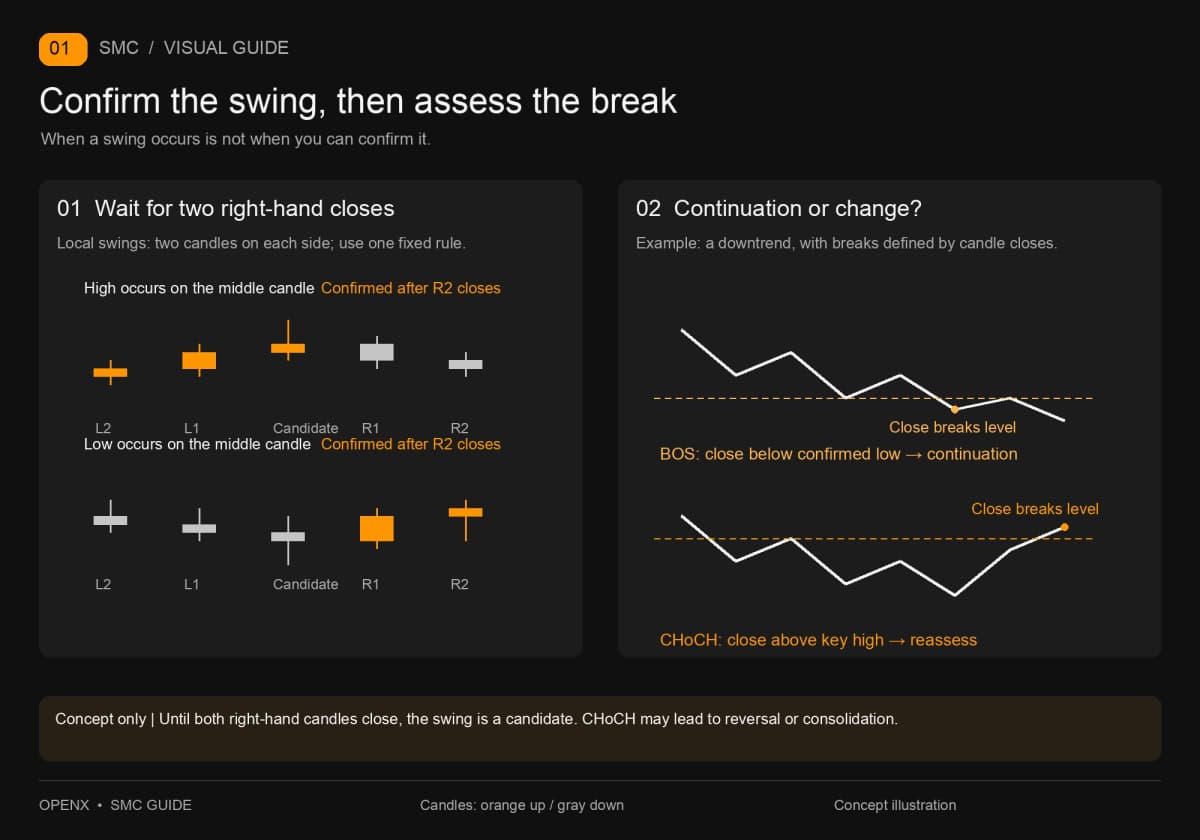
Your swing-point rule must also stay consistent. For example, mark a local low only when a candle's low is below the lows of the two candles on either side; leave equal lows unclassified under this rule. This requires waiting for both candles on the right to close. Its role is to create repeatable reference points. A level confirmed later must not be treated as information that was already available earlier.
BOS and CHoCH: Continuation or a Change in Structure?
BOS means Break of Structure and commonly describes a break of an important swing point in the existing direction. CHoCH means Change of Character and flags a disruption to that structure. Here, a break requires a close beyond a level specified in advance. A wick that crosses the level and closes back is recorded separately as a crossing event.
In a downtrend, a break below a confirmed low may support a continuation scenario. A close above the key high maintaining that downtrend calls for reassessment. CHoCH does not guarantee a reversal, nor does it change the direction of every timeframe at once. Our example also uses the simpler condition of a close below the previous candle's low. That is not a full swing-based CHoCH; keep the two distinct.
For further practice separating a swing's occurrence from its confirmation, the planned English guide SMC Market Structure: BOS, CHoCH and Confirmation Timing will cover that distinction.
Liquidity: Identify Where Orders May Be Concentrated
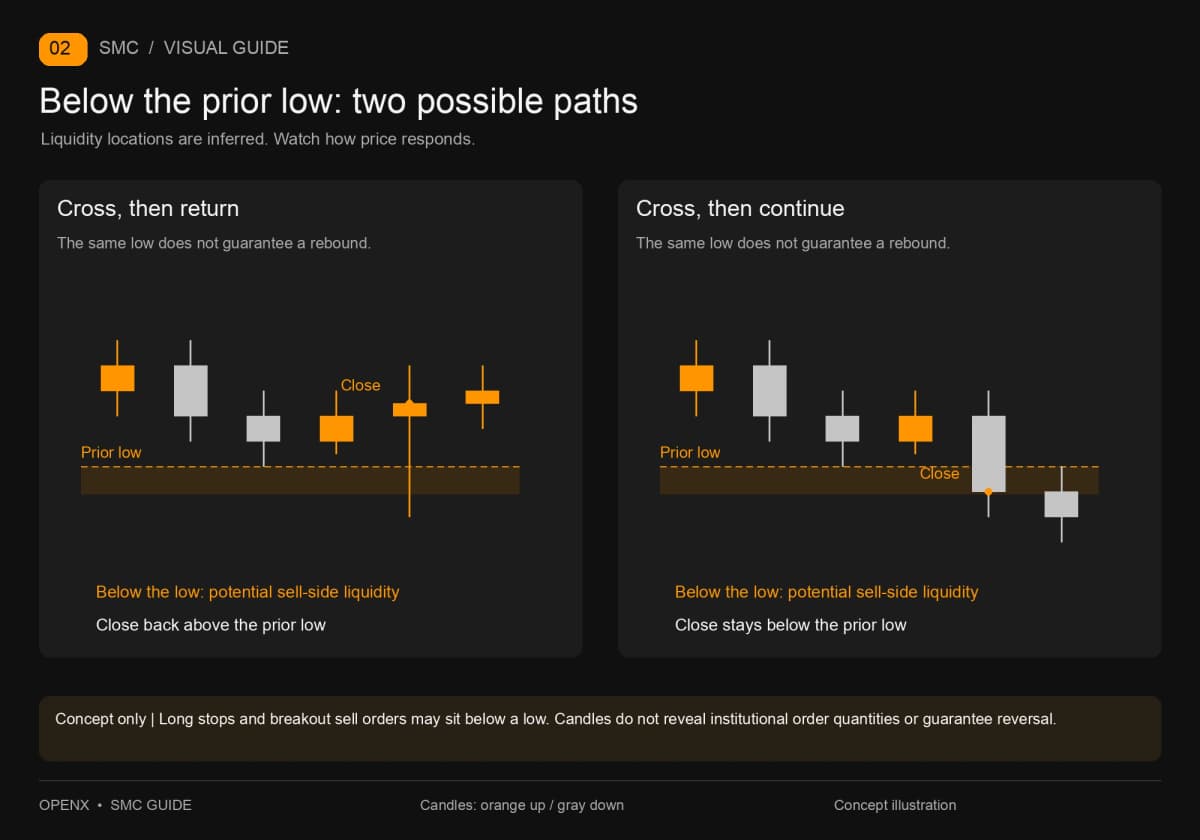
SMC commonly treats areas around prior highs, prior lows, equal highs and equal lows as potential liquidity zones. Above a prior high, there may be stops from short positions and breakout buy orders. Below a prior low, there may be stops from long positions and breakout sell orders. This is an inference about order distribution; candles alone cannot reveal the actual quantities.
A move below a low followed by a close back above it can be recorded as a potential downside sweep. Price may also keep falling after crossing that low. Liquidity analysis prompts you to check how price responds at a key location. A low that has already been swept can remain a fixed price target, but it can no longer be described as untouched liquidity.
The planned English guide SMC Liquidity: Buy-Side and Sell-Side Liquidity, Sweeps and Continuation will examine what to watch after a level is crossed.
Order Blocks: Identify a Candidate Zone Before a Price Move
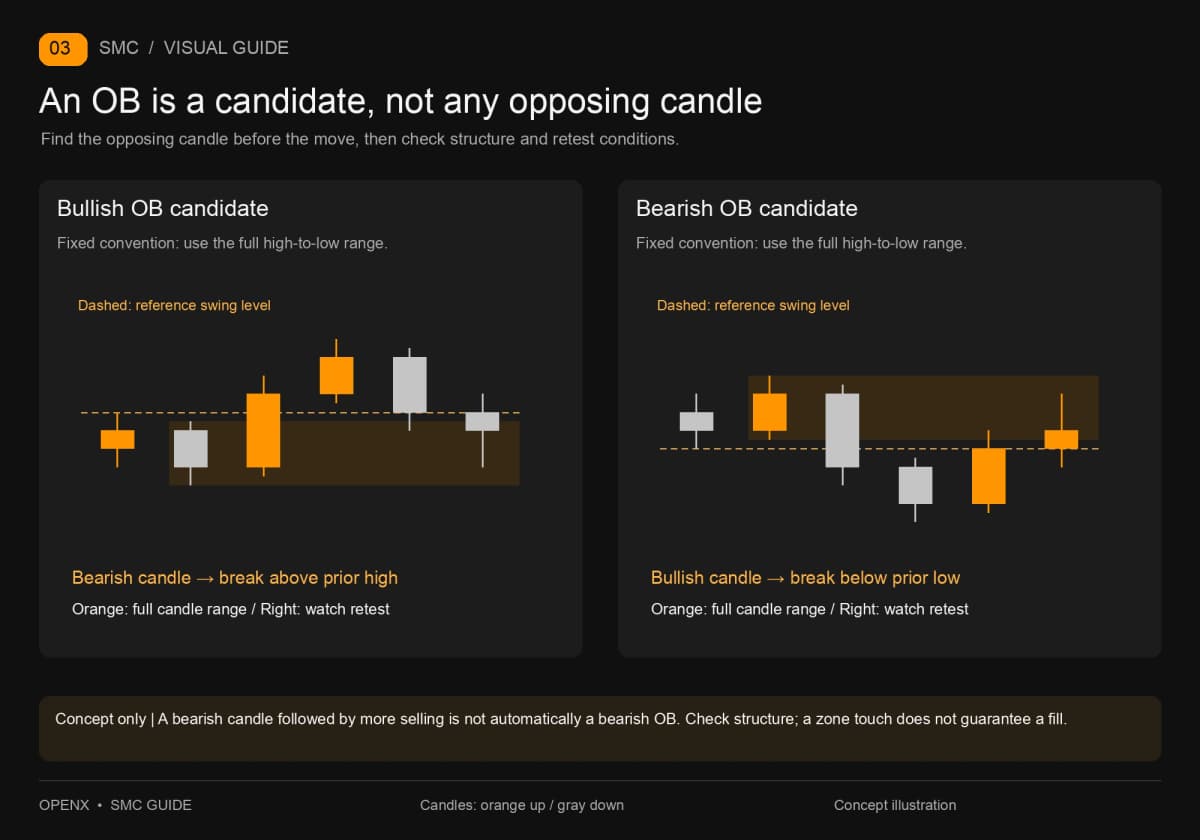
An order block is commonly identified using the last bearish candle before a strong rise, or the last bullish candle before a strong decline. After selecting it, check whether the subsequent move broke meaningful structure and whether the zone has already been retested. Every opposing candle is not automatically a valid OB.
You can draw the zone using the full high-to-low range or the candle body, but keep one convention throughout an exercise. The OB supplies a retest location; confirmation and stop rules are separate. In particular, distinguish a consolidation zone from an order block. A decline starting from a bearish candle does not automatically make that candle a bearish OB.
The planned English guide Order Blocks: Drawing Zones, Retest Entries and Invalidation will separate the source candle, retest and invalidation rules.
Fair Value Gaps: A Three-Candle Definition
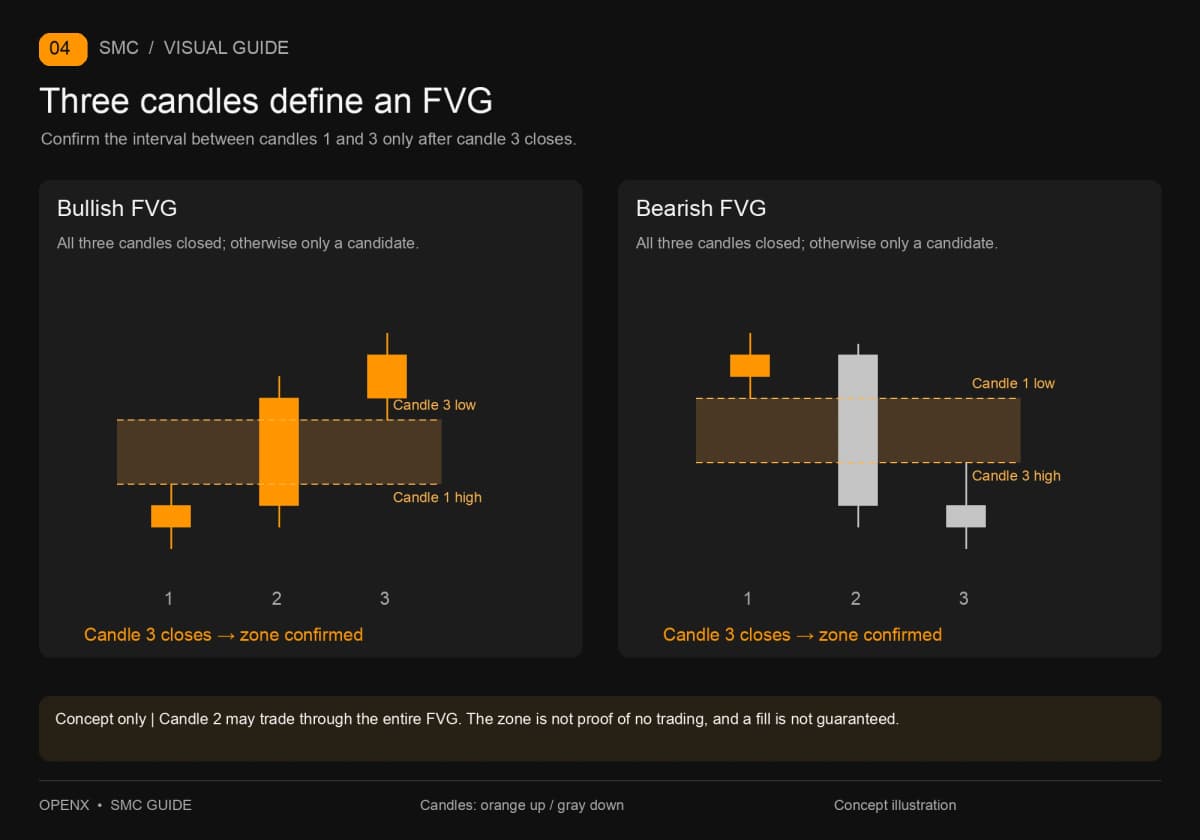
A fair value gap compares the wick ranges of three consecutive candles. If the first candle's high is below the third candle's low, the interval between them is a bullish FVG. If the first candle's low is above the third candle's high, it is a bearish FVG. The zone can only be confirmed after the third candle closes.
An FVG does not mean no trading occurred there: the second candle may have traded through the entire interval. It provides another potential retest zone, with no guarantee that it will be filled. We will identify an FVG alongside the example's observation zone, but will not switch entry zones after seeing the outcome. The planned English FVG Guide: Three-Candle Zones, Fills, Entries and Stops will explain how to keep a touch, a fill and a trade's result separate.
Breaker Blocks: A Zone Changes Roles After Invalidation
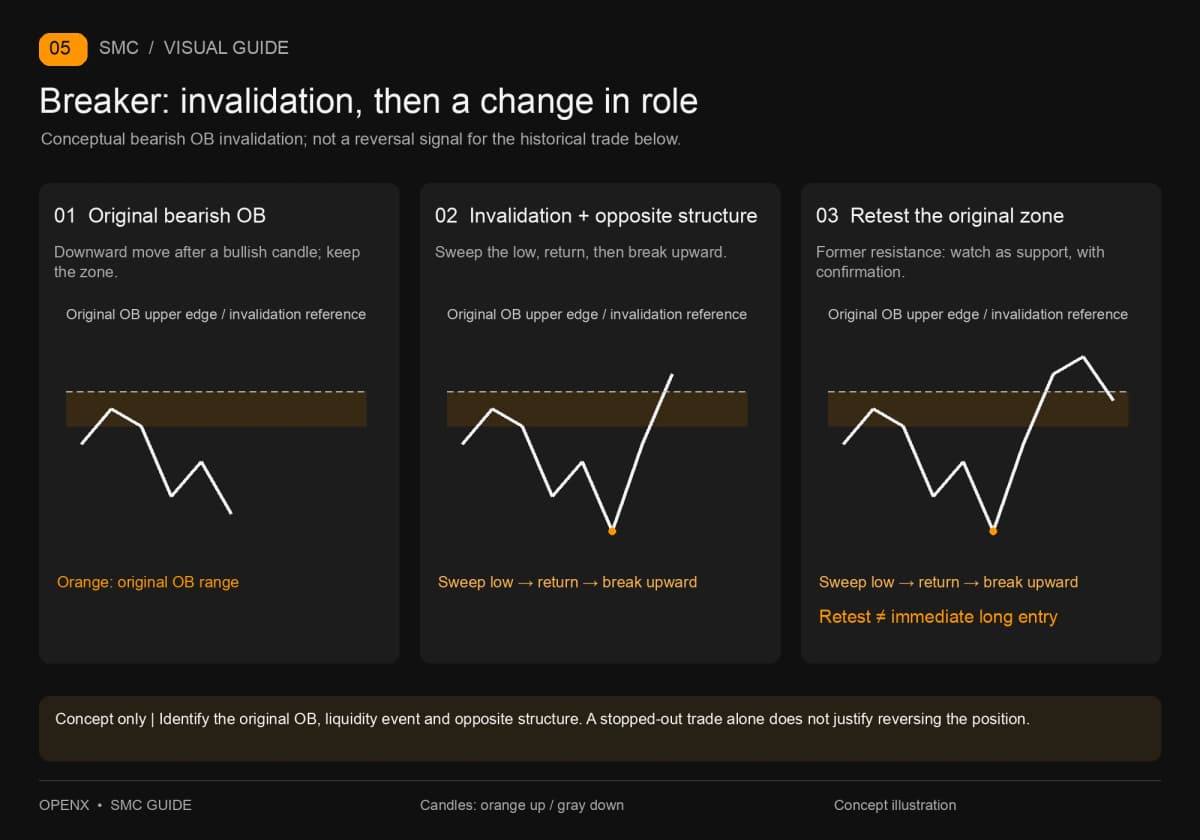
A breaker commonly describes an invalidated OB becoming a potential retest zone in the opposite direction. You should be able to identify the original OB, the break that invalidated it, and the associated liquidity event and opposite-direction structure. Not every rectangle that price crosses can simply be renamed a breaker.
Its purpose is to organize that change in role, not to tell you to reverse a position immediately after a stop-out. The example below does not establish a complete breaker entry setup, so it uses only its stated bearish rules. Learning a term does not mean every trade must use it. The planned English guide Breaker Blocks: OB Invalidation, Opposite-Direction Confirmation and Retests will work through that transition.
A Historical Example: Following One Simulated Short Trade
This example uses historical candles from the Binance BTCUSDT perpetual contract, with Bitcoin priced in USDT. The data was retrieved again on September 24, 2026. All times are in UTC; add eight hours for UTC+8. Candles are labeled by their opening time, while confirmation at the close becomes available only at the next time boundary. This is a historical teaching simulation. No orders were placed, and it is not an account of the author's own trade.
Step 1: Fix the Rules and the Four-Hour Direction
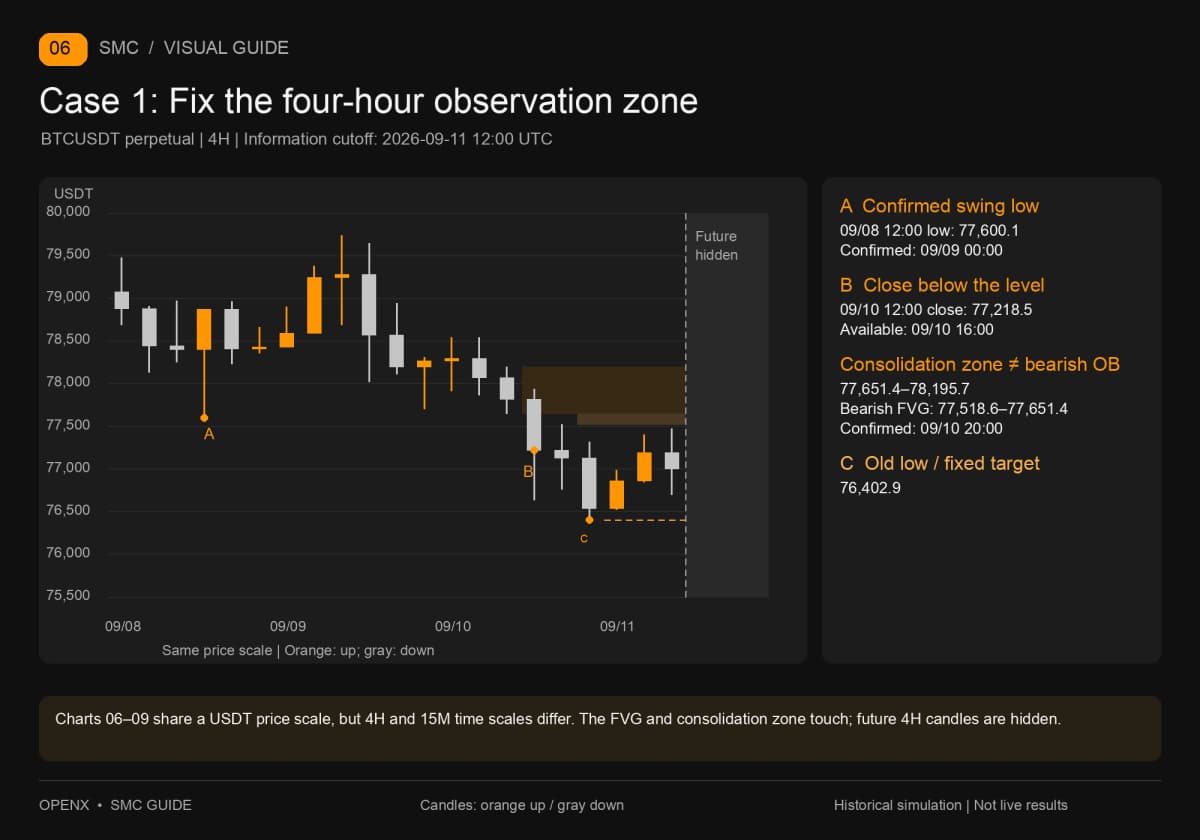
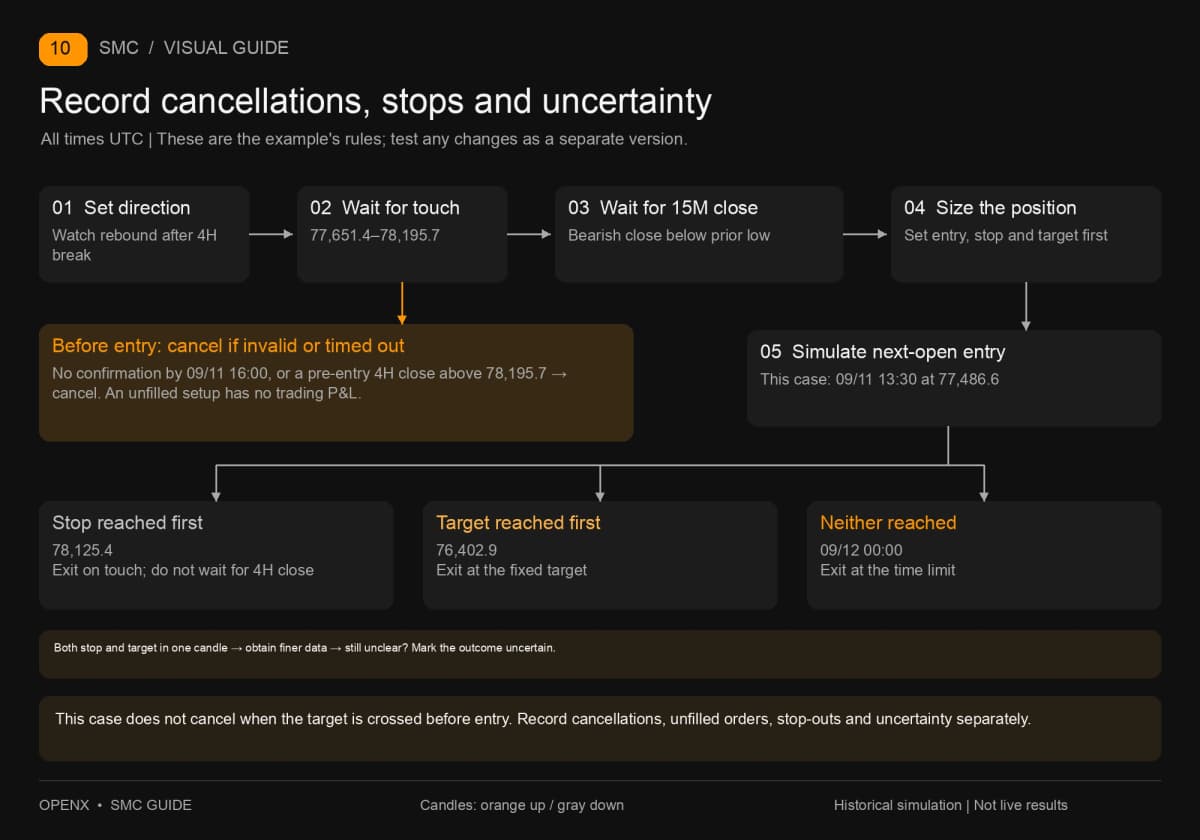
Set the starting point at September 11, 2026, at 12:00, using only four-hour candles already closed by then. The candle opening on September 8 at 12:00 had a low of 77,600.1, below the two candles on either side. That swing was not confirmed until September 9 at 00:00. The September 10 candle opening at 12:00 closed at 77,218.5. At 16:00 that day, its close confirmed a break below the swing low, giving this exercise an initial bearish view.
The directional rule is to watch for a rebound after a close below the specified low; this does not imply that every timeframe is falling. Before proceeding, fix the range of the four-hour consolidation candle opening on September 10 at 08:00, before the decline, as the rebound observation zone: 77,651.4–78,195.7. That candle is bearish, so we do not label it a bearish OB.
Use 15-minute candles for confirmation. From the starting point, wait for price to touch the zone, then for the first bearish candle to close below the previous candle's low. Simulate a short entry at the next candle's open. Cancel before entry if a four-hour candle closes above the zone's upper boundary, or if there is still no confirmation before 16:00 that day. Once in the trade, exit at whichever comes first: the stop or the target. If neither is reached, exit at September 12 at 00:00.
Fix the stop rule in advance too: take the highest price from the first zone touch through the confirmation candle and add a 10 USDT buffer. The target is 76,402.9, the low of the September 10 candle opening at 20:00, already known at the starting point. This version does not cancel if the target is crossed before entry. Calculate size using an assumed 10,000 USDT account and a 100 USDT price-risk budget, rounding down to increments of 0.001 BTC. Record fees separately.
These rules were fixed before scanning the 15-minute signals in this review, but the four-hour data had already been seen. This is a historical demonstration, not a blind test. We retain the existing dates instead of choosing a different case based on its profit or loss. To repeat the exercise, write down the conditions before advancing the chart.
Step 2: Wait for Lower-Timeframe Confirmation After the Touch
First, distinguish two adjacent zones. In the four-hour candles opening on September 10 at 08:00, 12:00 and 16:00, the first candle's low of 77,651.4 is above the third candle's high of 77,518.6. A bearish FVG is therefore confirmed at 20:00 that day. It touches the bottom of the original observation zone; they are not the same rectangle. We keep the consolidation zone and do not change the rule to “enter when price touches the FVG.”
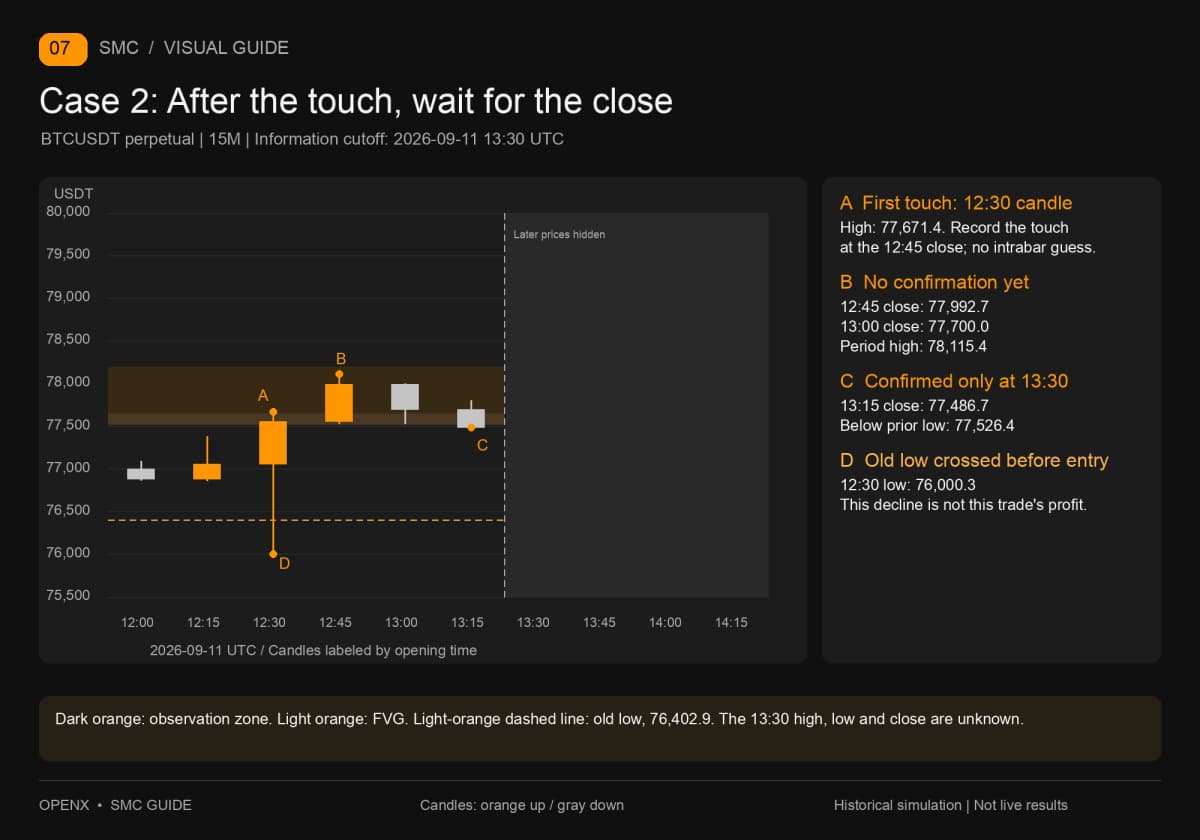
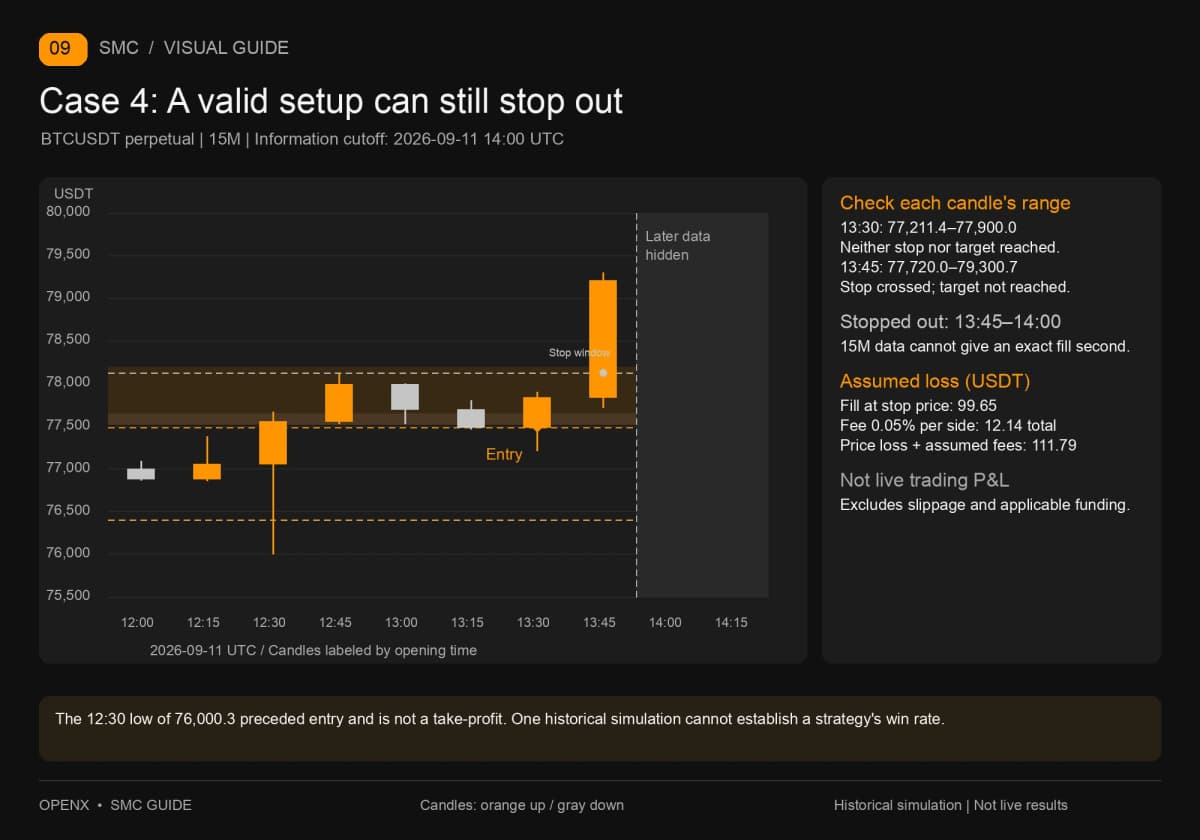
The 15-minute candle opening on September 11 at 12:30 reaches a high of 77,671.4, entering the observation zone for the first time, and closes at 77,558.1. Its low is also 76,000.3. The 15-minute data alone cannot establish whether the high or low came first. We therefore record the zone touch only after the candle closes at 12:45 and do not simulate a fill within that candle.
The 12:45 candle closes at 77,992.7 without bearish confirmation. The 13:00 candle falls, but its close of 77,700.0 remains above the previous candle's low of 77,527.8, so it does not qualify either. Finally, the 13:15 candle closes at 77,486.7, below the previous candle's low of 77,526.4. The condition is confirmed at 13:30. This wait matters: a bearish candle and the specified confirmation signal are not interchangeable.
Step 3: Calculate Entry, Stop, Target and Position Size
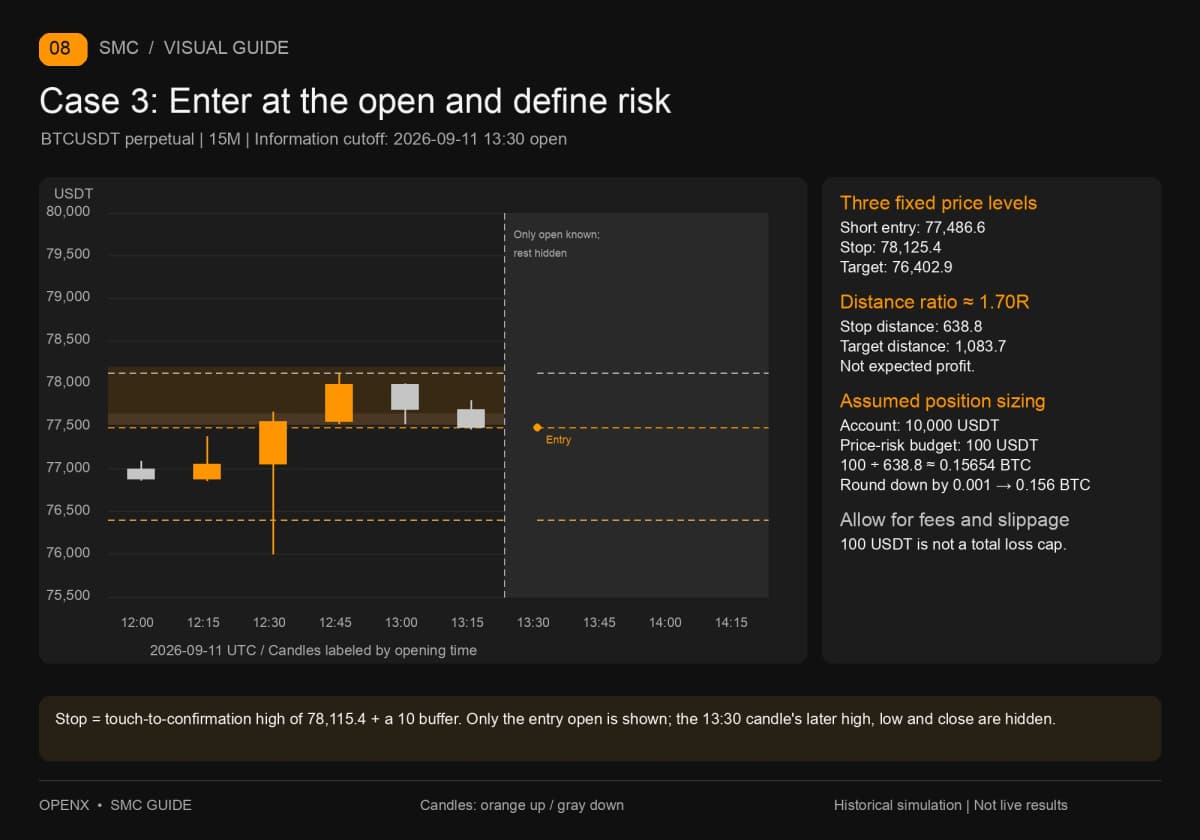
The next candle opens at 13:30 at 77,486.6, our simulated short-entry price. The highest price between the first touch and the confirmation candle is 78,115.4. Adding the illustrative buffer of 10 gives a stop of 78,125.4. This level invalidates this particular trade: exit when price touches it, without waiting for a four-hour close. The buffer is an example parameter, not an optimized or performance-tested setting.
Keep the target at 76,402.9, the low of the September 10 candle opening at 20:00, known before this exercise began. Price has already crossed it in today's 12:30 candle. At entry, it is therefore a target for revisiting an old price level, not untouched liquidity below the market. Our rules do not cancel when the target is reached before entry, so we continue and record that limitation. Adding such a filter would require a separate version and another test.
The stop distance per BTC is 78,125.4 − 77,486.6 = 638.8 USDT. The target is 1,083.7 USDT away, giving a potential reward of approximately 1.70 times the risk before costs. This is a distance ratio, not expected profit, and it cannot establish a win rate on its own.
With an assumed 10,000 USDT teaching account and a 100 USDT price-risk budget, theoretical size is 100 ÷ 638.8, or approximately 0.15654 BTC. Rounding down in increments of 0.001 BTC gives 0.156 BTC, for a price-only stop loss of 99.6528 USDT. This budget excludes costs. If 100 is the total loss limit, fees and a slippage allowance must be deducted before sizing; you cannot simply place an order for this quantity.
Step 4: Check the Outcome Candle by Candle
The 13:30 candle has a high of 77,900.0 and a low of 77,211.4, reaching neither stop nor target. The following 13:45 candle ranges from 77,720.0 to 79,300.7, crossing the stop without reaching the target. The simulated trade therefore stops out during 13:45–14:00. There is no need to guess whether the stop or target came first within that candle; the 15-minute data cannot identify an exact fill time in seconds.
Assuming a fill at the stop price, the price loss is approximately 99.65 USDT. Using an illustrative fee of 0.05% per side, round-trip fees are (77,486.6 + 78,125.4) × 0.156 × 0.0005, or approximately 12.14 USDT. Total loss is approximately 111.79 USDT. This is neither the account's actual fee rate nor a complete live-trading result: slippage and any applicable funding fees are not included.
Looking back, the earlier decline looks attractive, but it happened before entry and cannot be credited to this short. That is why I have kept this example. The directional view, zone touch and confirmation can all meet the rules, and the trade can still fail. The useful record is not simply “SMC doesn't work.” It is the original conditions, the execution outcome and the changes you want to test independently next time.
Common Mistakes and Practical Limits
One common mistake is selecting a new swing or changing an OB boundary after a stop-out until the chart looks convincing again. Record swing-selection rules, confirmation times and cancellation conditions in a journal. The planned English Trading Journal Guide: Separating Plans, Fills and Reviews will provide fields for this, helping distinguish a rule violation from a loss incurred while following the rules. If the target was crossed before entry, as in this example, retain that as a condition to investigate rather than deleting the trade afterward.
Confirmation has a cost. Waiting for a close can worsen the entry, while waiting for a limit order can leave you without a fill. Record cancellations and unfilled orders separately. An unfilled setup that later reaches its target is not a winning trade. If one candle reaches both stop and target, obtain finer-grained data; if the sequence remains unclear, mark the result as uncertain.
Costs change the risk you think you are taking, as this example shows. Triggering a stop does not guarantee a fill at its specified price, and slippage can increase losses during sharp moves. With perpetual contracts, also check funding, margin and liquidation conditions. This article calculates only price risk and assumed trading fees; it does not validate any leverage setting.
If you repeat the exercise in TradingView, the historical chart in Bar Replay does not turn ordinary Paper Trading or broker orders into historical fills. Historical trade simulation uses the separate Replay Trading feature. Set the capital, currency and commission first, and export the trade records before leaving the session. Mixing these tools can make your backtest records incomparable.
Where to Continue Learning SMC
Repeat this example first and make sure you can explain what each step is waiting for. Then choose what you need to study in more depth. The following six guides form a learning sequence covering structure, liquidity, observation zones and review. Their English versions are planned; links will be added when those versions are available.
- English guide planned — SMC Market Structure: BOS, CHoCH and Confirmation Timing. Explore swing selection and decisions across timeframes.
- English guide planned — SMC Liquidity: Buy-Side and Sell-Side Liquidity, Sweeps and Continuation. Compare a crossing followed by a return with continued movement beyond a level.
- English guide planned — Order Blocks: Drawing Zones, Retest Entries and Invalidation. Separate zone invalidation from a trade's stop and check the retest sequence candle by candle.
- English guide planned — FVG Guide: Three-Candle Zones, Fills, Entries and Stops. Separate a filled price zone from a profitable trade.
- English guide planned — Breaker Blocks: OB Invalidation, Opposite-Direction Confirmation and Retests. Follow one zone through the conditions for a change in role.
- English guide planned — Trading Journal Guide: Separating Plans, Fills and Reviews. Keep market data, simulated fills and costs in separate records.
This article is for learning and simulation practice, not personalized investment advice. First, complete the same set of rules faithfully. Then use more records to assess whether it has value.