Smart Money Concepts (SMC) liquidity analysis uses locations such as prior highs and lows to infer where conditional orders may cluster. Buy-side liquidity is watched above highs and sell-side liquidity below lows; neither is the same as visible order-book depth. This guide uses Binance Academy's stop-order explanation to describe trigger direction, then applies its own closing rules to distinguish a sweep and return from continuation outside a boundary. A crossing does not guarantee reversal.
You may have seen price dip below a prior low and immediately recover, leaving an earlier stop level looking like the exact bottom in hindsight. On another chart, the same break keeps falling. Calling both “institutions sweeping liquidity” still leaves you unsure what to watch next. I find the most useful exercise is to fix the line first, then let the close show what happened this time.
We will explain buy-side and sell-side liquidity and how to mark their locations, then follow one Bitcoin sequence to record sweeps and returns, untouched boundaries and closes outside the range. The exercise is recognizing price events, not placing a trade whenever you see a wick.
Two meanings of liquidity to keep separate
An SMC liquidity location is an inference; resting order-book depth is a different dataset. SMC means Smart Money Concepts. It treats obvious highs and lows as potential order-trigger areas to help organize observation. Read alongside the SMC strategy guide — English link to follow for the full sequence; here we focus on locations and the response after crossing them.
Buy-side and sell-side refer to potential trigger direction
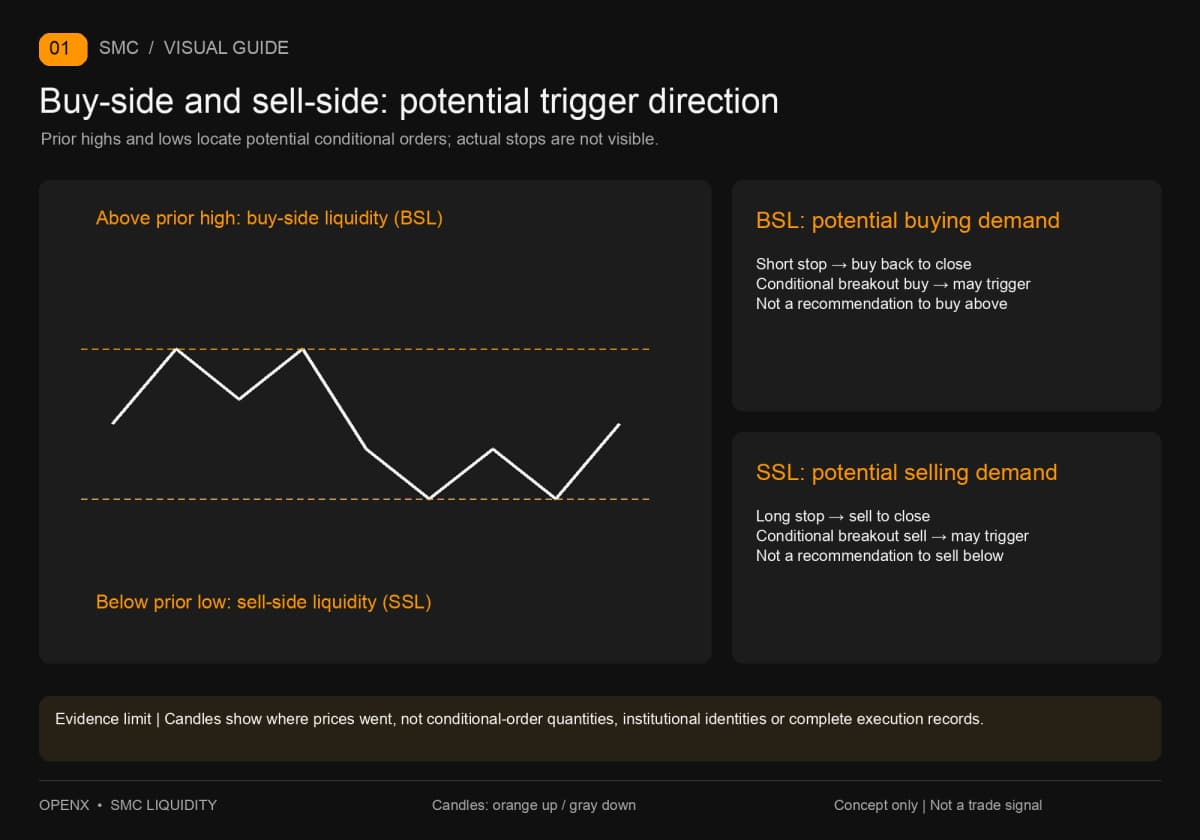
Buy-side liquidity (BSL) is watched above highs; sell-side liquidity (SSL) below lows. Think about a position holder's next action. A short seller buys back to close. A stop above a prior high may therefore trigger buying demand. A long holder sells to close, so stops below a prior low correspond to potential selling demand. Conditional breakout buy and sell orders may also trigger nearby.
“Buy-side” does not mean you should buy there, or that only buy orders exist above the high. It describes the potential trigger direction that this SMC term focuses on. Counterparties, existing limit orders and new orders also affect execution. The label alone cannot predict the next candle.
Potential stops are not already executable resting orders
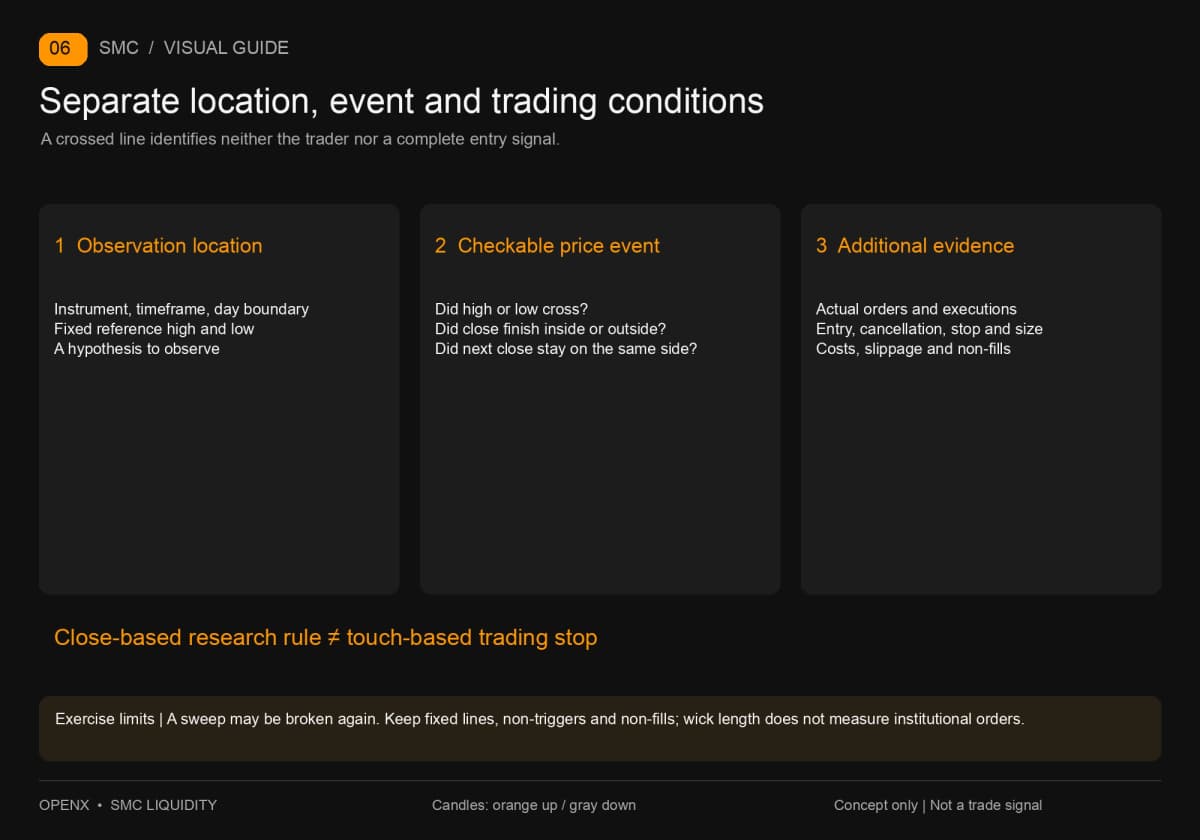
Triggering a conditional order and filling it completely are separate steps. Binance Academy's “What Is a Stop-Limit Order?”, in the version updated August 11, 2026, explains that a stop-limit order submits a limit order after triggering. A fast move beyond the acceptable price may leave it unfilled. A stop-market order fills at available prices and can experience slippage—the difference between expected and actual execution prices. The source guide checked that document on September 29, 2026.
This is why a shaded area above a high is not a measured order quantity. CME Group's April 26, 2024, “Understanding the CME Liquidity Tool Methodology” uses an electronic limit order book to calculate bid–ask spreads, depth and trading costs. Those require quotes and quantities. Here we have only open, high, low and close prices. They show crossings and closes, not institutional identities, actual stop quantities or the execution status of every order.
How to mark liquidity locations
Fix the instrument, timeframe and time boundaries before drawing highs and lows. Then you know which line the next observation tests. Beginners can start with the previous completed day's high and low because the selection is easy to reproduce. If using swings instead, define confirmation first so a turning point confirmed later is not inserted into an earlier plan.
Prior-day levels, equal highs and lows, and internal versus external locations
Even “yesterday's high and low” requires a definition of the day. This crypto example uses Coordinated Universal Time (UTC), from midnight to the next midnight. The same interval in UTC+8 runs from 08:00 to 08:00 the following day; the data is unchanged. Starting the day at midnight UTC+8 would select a different set of candles. Do not choose whichever high and low suit the result and call both yesterday's range.
Equal highs or lows are observations of multiple points at the same or nearby prices. If “nearby” qualifies, fix both the price tolerance and point-selection method beforehand. No one distance suits every instrument. This example does not filter for equal highs or lows, so we will not add a tolerance afterward to manufacture a double top.
We call locations beyond the fixed range's upper and lower edges external observation locations; smaller highs and lows inside it are internal. Those descriptions are relative to the selected range, not permanent properties of a price. A point can lie inside a four-hour range but outside a fifteen-minute range. Start with one set of boundaries and leave other lines unused instead of making the entire chart a potential sweep location.
For the detailed swing-confirmation method, see swing confirmation timing — English link to follow. A Break of Structure (BOS) describes continuation in the existing direction, while a Change of Character (CHoCH) describes a structural change. Using a completed prior-day range is enough for the exercise below.
Sweeps and continuation: which close should you wait for?
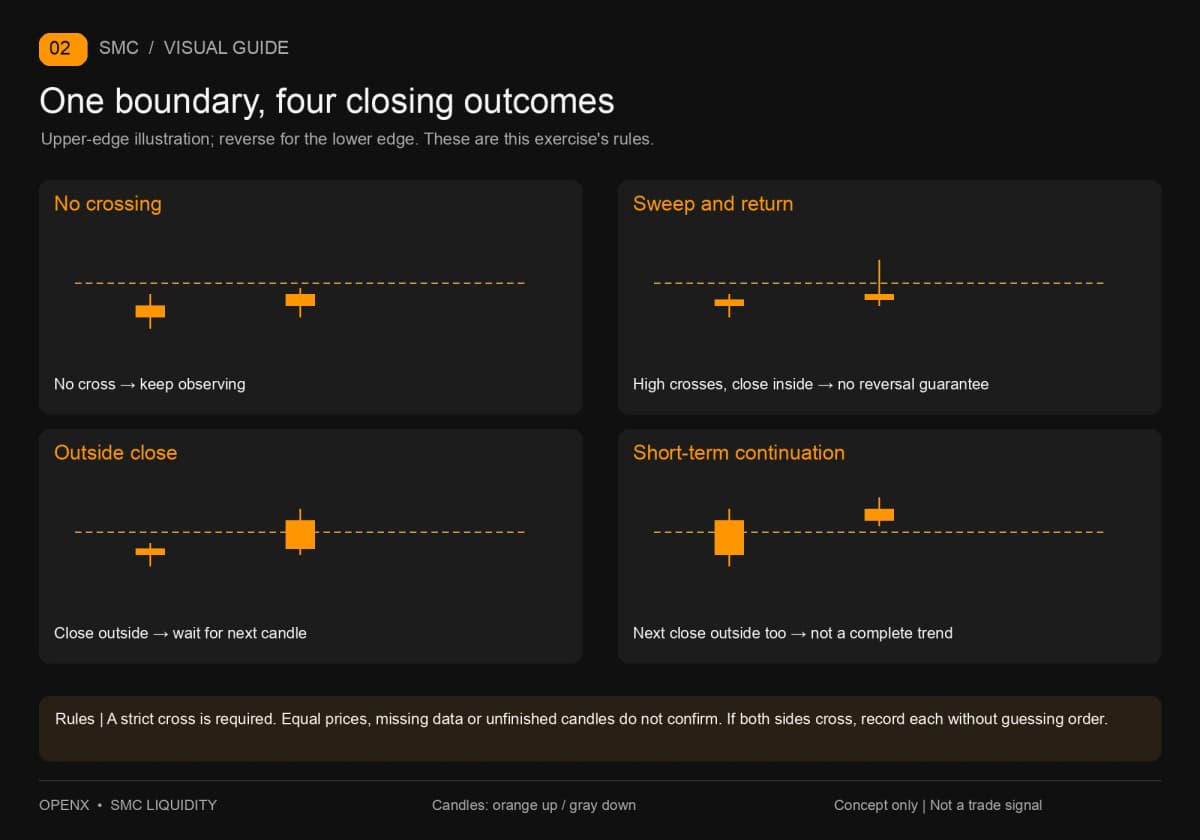
Record a cross and return separately from a close outside the range. Neither is automatically a trade signal. To make this exercise repeatable, we use “sweep” narrowly: the candle strictly crosses a fixed boundary and closes back on that boundary's inner side. Touching the exact price does not count as crossing, and an unfinished candle gets no final label. If price crosses but closes exactly on the line, record “closed at boundary; unclassified.” It is neither a sweep and return nor an outside close. Do not move the line mid-candle.
These are this exercise's conventions, not universal definitions across all SMC methods. Apply them symmetrically to both sides, always using the line fixed in advance.
| What is visible after the close? | Record in this guide | Next step |
|---|---|---|
| Neither high nor low crosses the boundaries | No crossing | Keep the lines and observe |
| Price strictly crosses one side and closes back inside that side | Sweep and return observation | Record the event without assuming reversal |
| Close remains strictly outside one side | Outside close | Wait for the next candle; continuation is not yet confirmed |
| Next candle also closes outside the same side | Short-term continuation observation | Keep both closes; this is not a complete trend |
If the next candle returns inside the original boundary, separately record “no continuation.” A sweep and return may later be broken again; it is not permanent support or resistance. If a candle crosses both sides, record each side without guessing which came first within the candle. Missing data or an unfinished candle pauses classification. These closing rules are for research. A trading plan with a touch-based stop must not delay its exit while waiting for a candle to finish.
Historical BTC example: one set of boundaries, two paths
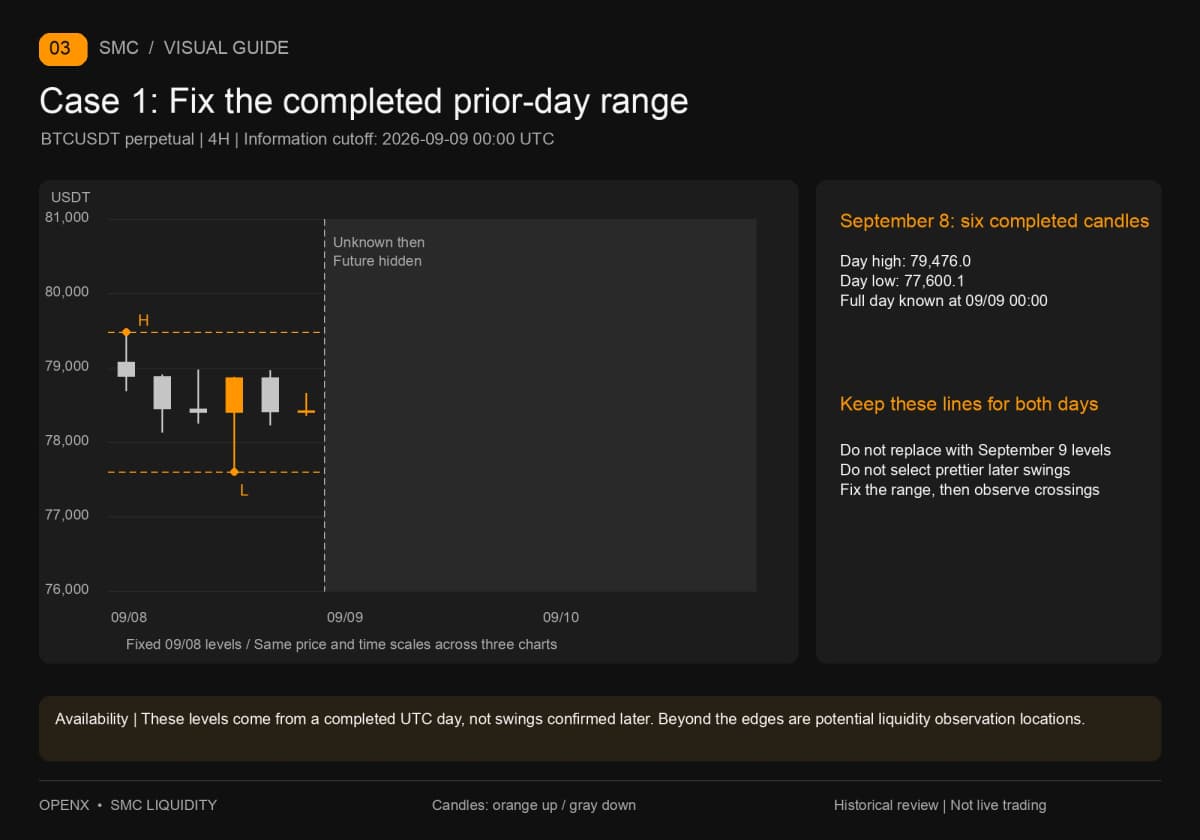
We use Binance BTCUSDT perpetual-contract four-hour candles. BTC is Bitcoin, USDT is a stablecoin, and BTCUSDT is a Bitcoin instrument quoted in USDT. The source guide retrieved 88 candles again on September 29, 2026, with opening times from September 2, 2026, at 20:00 to September 17 at 08:00 UTC. They match the preceding series archive element by element. We observe twelve candles on September 9 and 10, ending on September 11 at 00:00.
This window was already used in the series. It is a review of a fixed historical interval, not a blind test of unseen prices. There are no simulated orders, stop prices or profit results, and the example was not selected for a later profitable outcome. Candles are named by opening time: the 08:00 candle completes at 12:00. Every final classification is recorded after its close.
Step 1: Use only the completed prior-day range
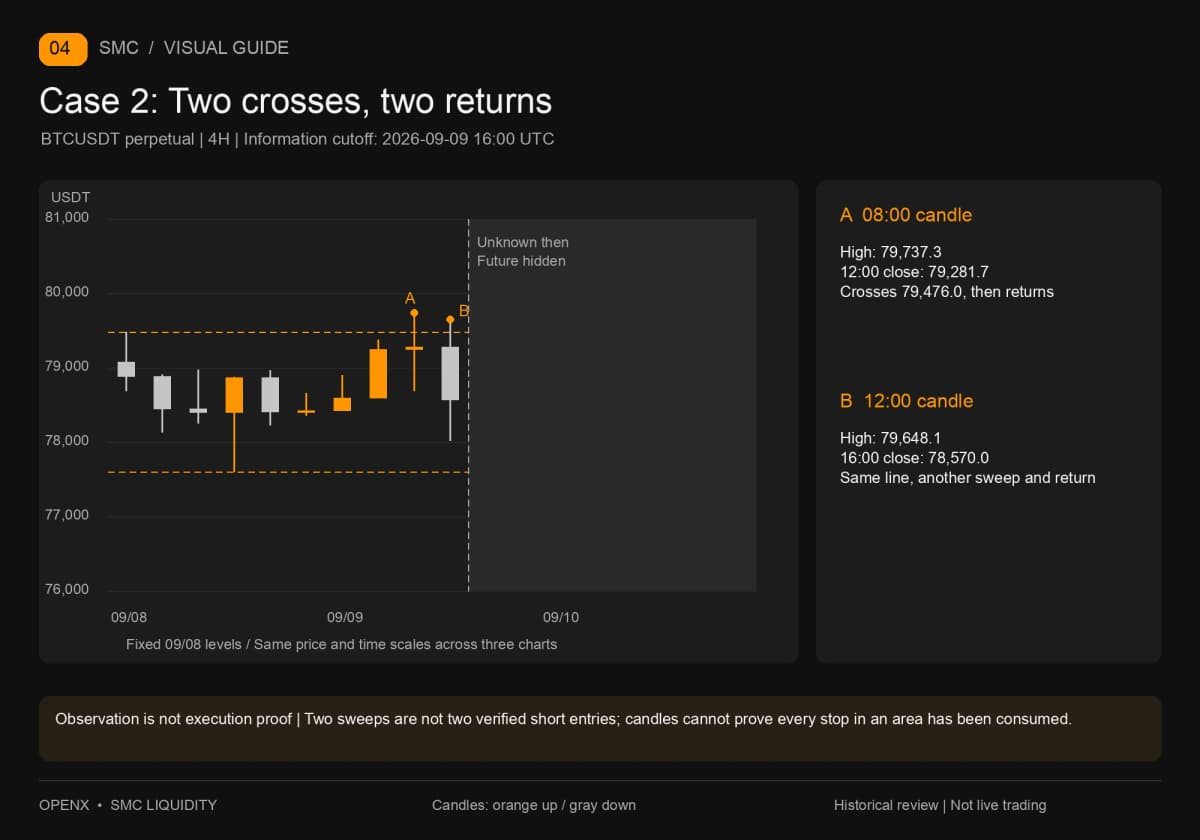
Pause at September 9, 00:00. All six four-hour candles from September 8 are complete. The day's high of 79,476.0 occurred on the 00:00 candle, and its low of 77,600.1 on the 12:00 candle. Draw those numbers as a fixed range. Mark potential buy-side liquidity outside the upper edge and potential sell-side liquidity outside the lower edge.
You do not yet know which side will be touched first. What you do know is that the selection is complete and can be checked consistently afterward. Keep September 8's lines for both days of this exercise. Do not replace them with a new prior-day range on September 10. A daily rolling rule would be a different experiment, not a change to make halfway through this one.
Step 2: Price crosses the high but closes back inside
The first two September 9 candles have highs of 78,899.0 and 79,376.4, both below the upper edge. The 08:00 candle then reaches 79,737.3, crossing the fixed 79,476.0 for the first time. During the candle, you can record a crossing, but not yet a sweep and return. A final close above the edge would mean a different classification.
At 12:00, the close is confirmed at 79,281.7, below the upper edge. Only now do we record an upper sweep and return. The chart proves that the high exceeded the reference and the close finished inside. It does not prove that all short stops were consumed or that an institution was selling. We do not have those order records.
The next candle, opening at 12:00, reaches another high of 79,648.1 and closes at 78,570.0 at 16:00. Using the same old line, that is another sweep and return. Keep this detail: one crossing does not establish that the area has “no liquidity left” or that price will never return. Two sweeps are two price records, not two verified short opportunities.
Step 3: Approaching the low is not crossing it
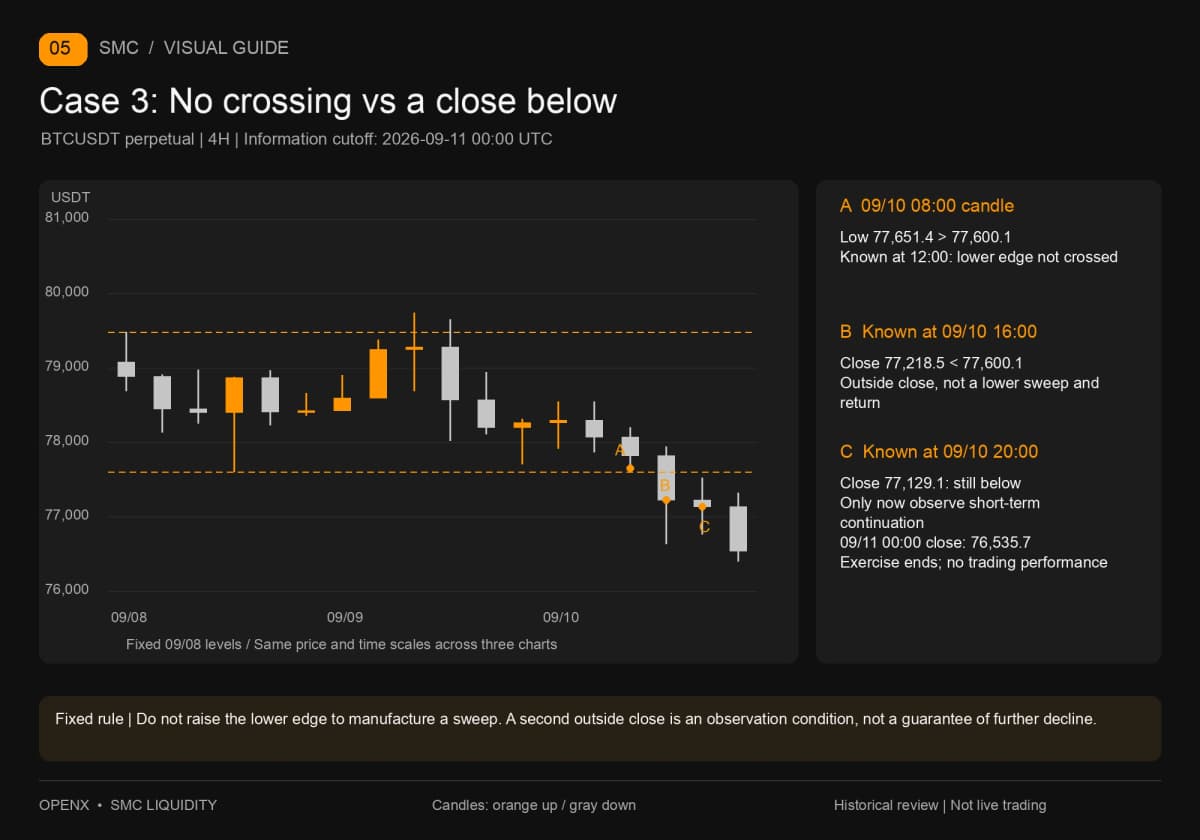
Price next moves lower, but the September 10, 08:00 candle reaches only 77,651.4, still above the fixed lower edge of 77,600.1. It closes at 77,816.4 at 12:00. With our unchanged reference, this candle did not sweep the selected prior-day low. Record no crossing.
If you move the line upward to another local low, the candle may look like a lower sweep and return, but you have changed the question. You can study that local point in another field; you cannot rewrite this fixed-range record. Keeping this counterexample helps catch the habit of calling every lower wick a liquidity sweep.
Step 4: After a close below the low, check the next candle
The September 10, 12:00 candle reaches a low of 76,634.3 and closes at 77,218.5 at 16:00. Both the low and close are below 77,600.1. The conclusion at this moment is a lower outside close, not a downward sweep and return. You do not need to predict how much further it will fall. First reject a reversal label that contradicts the close.
The 16:00 candle closes at 77,129.1 at 20:00, still below the same lower edge. Only now does it meet our short-term continuation observation. The final 20:00 candle has a low of 76,402.9 and closes at 76,535.7 on September 11 at 00:00, also below the edge. The exercise ends there. Later rallies or declines do not rewrite the earlier records.
With the same boundaries, the upper side produced crossings and returns; the lower side produced an outside close followed by another outside close. That is what liquidity locations help organize: decide where to watch in advance, then identify the response there. If potential sell orders below the range automatically mean “price must rebound,” you will read the entire second half backward.
Keep all twelve candles, not just attractive wicks
The complete window includes candles with no event. Those blanks stop you counting only the outcomes you hoped to see. The table uses information available after each close; all dates and times are UTC.
| Candle opens | Close becomes available | Fixed-range event |
|---|---|---|
| 09/09 00:00 | 09/09 04:00 | Neither side crossed |
| 09/09 04:00 | 09/09 08:00 | Neither side crossed |
| 09/09 08:00 | 09/09 12:00 | Upper sweep and return |
| 09/09 12:00 | 09/09 16:00 | Upper sweep and return |
| 09/09 16:00 | 09/09 20:00 | Neither side crossed |
| 09/09 20:00 | 09/10 00:00 | Neither side crossed |
| 09/10 00:00 | 09/10 04:00 | Neither side crossed |
| 09/10 04:00 | 09/10 08:00 | Neither side crossed |
| 09/10 08:00 | 09/10 12:00 | Approached lower edge without crossing |
| 09/10 12:00 | 09/10 16:00 | Lower outside close |
| 09/10 16:00 | 09/10 20:00 | Second close below: short-term continuation observation |
| 09/10 20:00 | 09/11 00:00 | Close remains below; exercise ends |
Hide future candles when repeating the exercise and add one row after each close. If your result differs, first check the instrument, UTC day boundary and reference lines, then highs, lows and closes. Do not simply change your answer to match. These twelve classifications supply no win rate: no trade has been defined, and execution costs have not been included.
Common mistakes and your next exercise
The easiest mistake is turning an observation location directly into a reason to enter. A sweep and return only describes where price closed. To study trading, separately fix structure confirmation, a candidate entry zone, cancellation, stops and size. You cannot pretend to have filled at the wick's extreme using a classification known only after the close.
Another mistake is treating the most obvious location as the one guaranteed to contain the most orders. Equal highs may be easy to spot, but they are not a measurement of conditional orders. An order-book screenshot also shows only one platform's visible depth at one moment, not every venue or untriggered order. Slippage and non-fills still need separate treatment in fast markets; a liquidity line cannot remove them.
Complete this record first, then connect it to candidate-zone analysis. Continue with Order Blocks: Drawing OB Zones, Retests and Invalidation — English link to follow to connect fixed boundaries and sweep records to an observation zone. If swing availability is still unclear, return to SMC Market Structure: BOS, CHoCH and Confirmation Timing — English link to follow and repeat the point-selection exercise.
This article is for education and historical chart practice, not investment advice. SMC labels guarantee neither direction nor profit. Real trading can lose principal, and contract leverage amplifies risk.