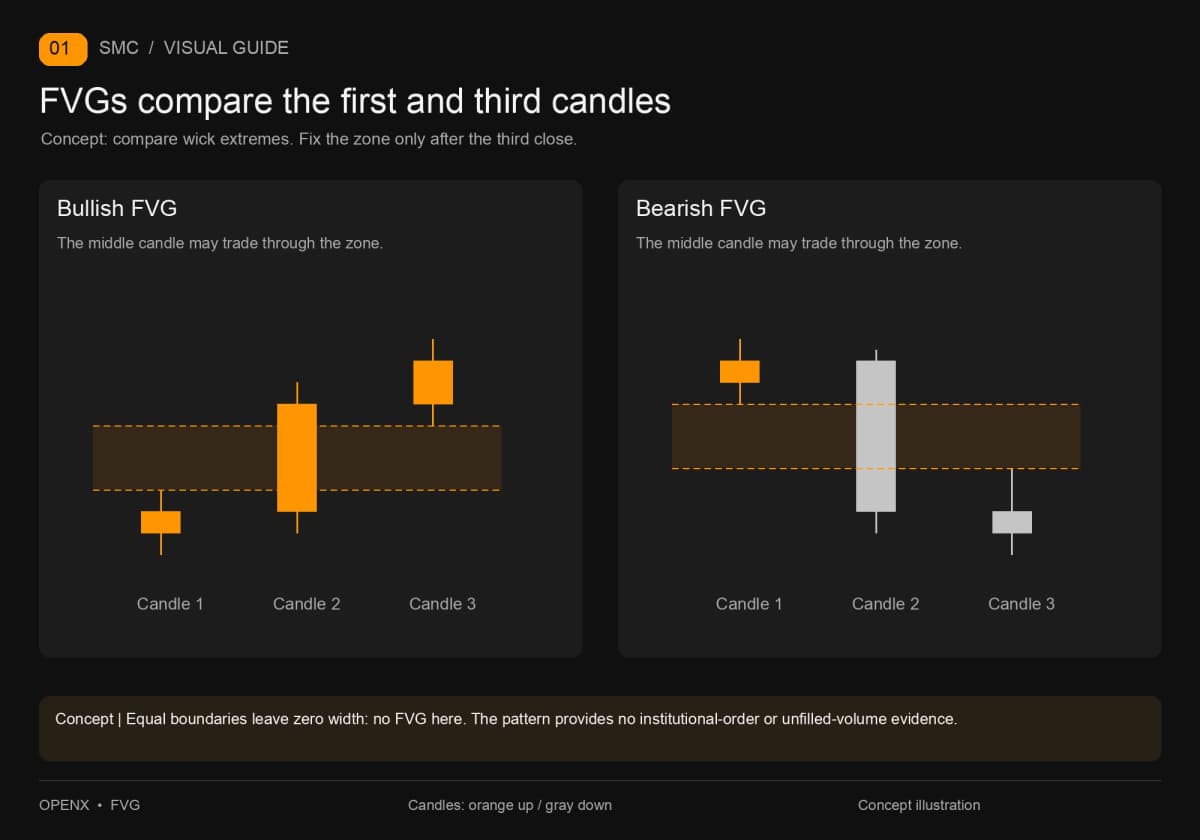
A fair value gap (FVG) is the non-overlapping interval between the first and third candles' wicks in a three-candle sequence, confirmed when the third closes. QuantRX's Fair Value Gap documentation also uses three candles. Unlike an adjacent-candle gap, the middle candle may have traded through the zone. Here it locates a potential retest; entries and stops need separate rules, and a fill does not mean a profit.
You draw a neat gap, and price eventually fills it. Does that make the trade a success? Before ticking the box, check the sequence. In the Bitcoin example below, the gap fills completely, but the short reaches its stop first under the teaching rules set out in advance. The difference lies in when price visited those levels, not whether the rectangle was drawn correctly.
We will first explain the three candles and four zone states, then follow one sequence through marking, waiting, position sizing and exit. You can hide the right side and repeat the exercise rather than accepting the answer only after seeing the final chart.
An FVG marks the relative positions of three candles
An FVG identifies a price interval to observe; it does not independently decide whether to buy or sell. It is one marking method within Smart Money Concepts (SMC). For direction, liquidity and risk together, return to the SMC strategy guide — English link to follow. Here we examine how this particular zone forms and how the exercise uses it.
Bullish and bearish gaps: compare the first and third candles
A bullish FVG requires the third candle's low to be above the first candle's high. Mark the interval between those prices. A bearish FVG requires the third candle's high to be below the first candle's low; mark the interval from that third high to the first low. Compare wick extremes, not candle bodies. Equal boundary prices leave zero width and do not qualify as a gap in this guide.
The middle candle commonly carries the move away, but this definition does not mean the interval never traded. Its high-to-low range may cover the entire rectangle. What we observe is that the first and third candles do not cover the same interval. This does not provide direct evidence of institutional orders or a measured imbalance in buying and selling volume. “Fair value” is the conventional name for the pattern, not a calculation of what the asset ought to be worth.
The rectangle becomes fixed only after the third close
While the third candle is open, its high and low can still change. An apparent interval may disappear as that same candle extends its wick. We therefore use three completed candles. You can draw the zone back over earlier candles, but its recorded availability time must be when the third candle finished.
Tools may add matching candle colors, minimum gap size or displacement requirements. QuantRX's Fair Value Gap description on TradingView offers a wait-for-close option; HuntsPip's Fair Value Gaps description provides several fill criteria. The source guide checked these public descriptions on September 30, 2026. A rectangle disappearing from an indicator does not necessarily invalidate every trader's rules. This guide uses only the three-candle wick definition; other conditions must be stated separately before comparing results.
How far a gap fills is separate from whether a trade profits
A zone state describes where price went. Profit and loss also require entry timing, execution prices and exit rules. Keep separate records so that “the gap filled completely” and “price moved against the position after entry” can both be true.
Touch, partial fill, complete fill and invalidation
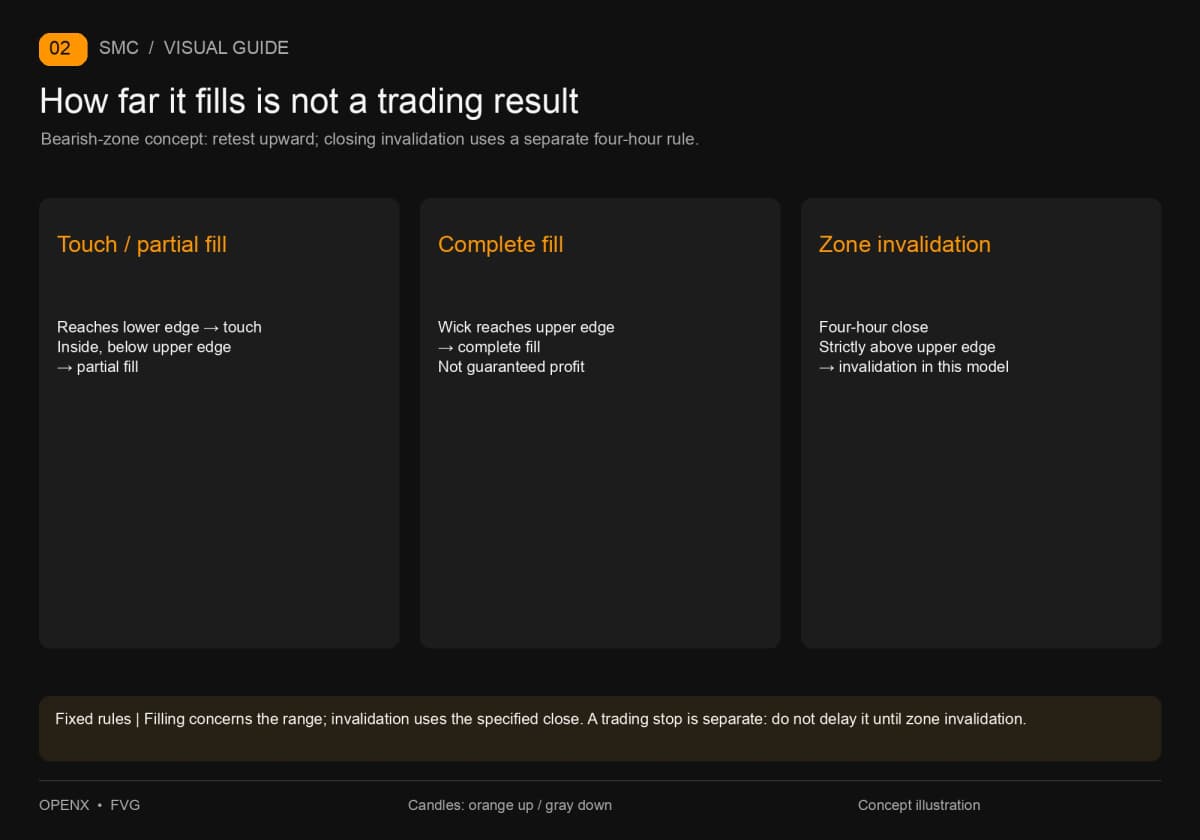
Consider price returning upward into a bearish FVG. Reaching its lower boundary is a touch. Moving inside without reaching the upper boundary is a partial fill. Reaching the upper boundary is a complete fill. The midpoint is simply the average of the two boundaries; some tools call it consequent encroachment (CE). It is not another guaranteed reversal price. Waiting at the lower edge or midpoint changes both the likelihood of a fill and the distance to a stop.
This guide separately defines invalidation as a four-hour close strictly above the bearish zone's upper boundary. A wick reaching that boundary can establish a complete fill without establishing closing invalidation before the four-hour candle ends. A wick-based invalidation rule is another possible model, provided you fix it beforehand rather than adopting a more forgiving rule after a stop. Reverse the direction for a bullish gap: observe price returning downward, with the lower boundary as the far edge.
FVGs and order blocks answer different questions
An FVG compares the non-overlapping interval across three candles. An order block (OB) looks for an opposing source candle before a move. For the latter's details, see the order block source and invalidation guide — English link to follow. The zones may be close together or far apart. Their appearance in the same SMC tutorial does not make the names interchangeable.
This example does not require an FVG to overlap an OB, and it adds no indicator filter to the entry. Completing one checkable set of rules makes it easier to understand what you tested than adding whichever tool happens to explain the outcome afterward.
Historical BTC example: a complete fill, but a stopped-out short
The example uses historical Binance BTCUSDT perpetual-contract prices to separate zone fills from trading outcomes. BTC means Bitcoin; USDT is the quote unit. A perpetual contract is a derivative, not ownership of spot Bitcoin. The source data was retrieved again on September 30, 2026: 88 four-hour candles, 96 fifteen-minute candles covering September 11, and 30 one-minute candles from 12:30 through 12:59 that day. Aggregating the minute data reproduces the corresponding fifteen-minute candles.
This sequence has already appeared in the series. It is a review of known history, not a blind test, and it includes no actual order reports. Entry, buffer, account size and fee rates below are teaching assumptions. Raw prices establish touches and their order. All times use Coordinated Universal Time (UTC); add eight hours for UTC+8. A continuously traded market still has fixed candle boundaries. A four-hour opening time and its completion time cannot be used interchangeably.
Step 1: Fix the three candles, boundaries and confirmation time
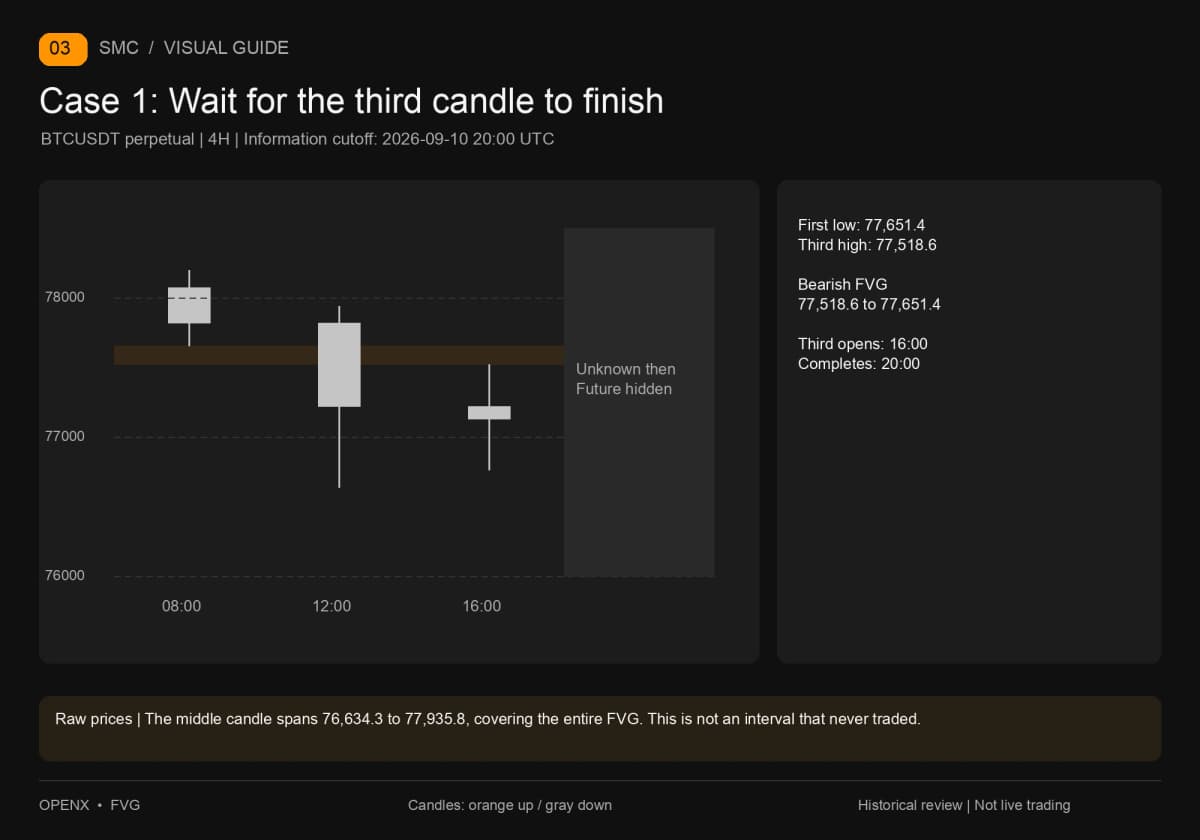
Read the four-hour candles opening on September 10 at 08:00, 12:00 and 16:00 in that order. The first low is 77,651.4, and the third high is 77,518.6. They do not overlap, so the bearish FVG runs from 77,518.6 at the lower edge to 77,651.4 at the upper edge, a width of 132.8. The third candle finishes at September 10, 20:00. Only then can the zone be used to wait for a fill.
Now check the middle candle: its high is 77,935.8 and its low is 76,634.3. The entire FVG sits inside that range. These prices show why non-overlap between the first and third candles cannot be translated into a claim that the interval never traded.
Step 2: Define entry, stop and cancellation before the fill
After confirmation, the teaching model waits for the first touch of the lower edge at 77,518.6 and assumes a limit short. The price stop is 77,700.0, and the target is twice the initial risk. The stop buffer is specified for this example; the FVG pattern does not supply it automatically. Risk per BTC is 77,700.0 − 77,518.6 = 181.4, making the 2R target 77,155.8.
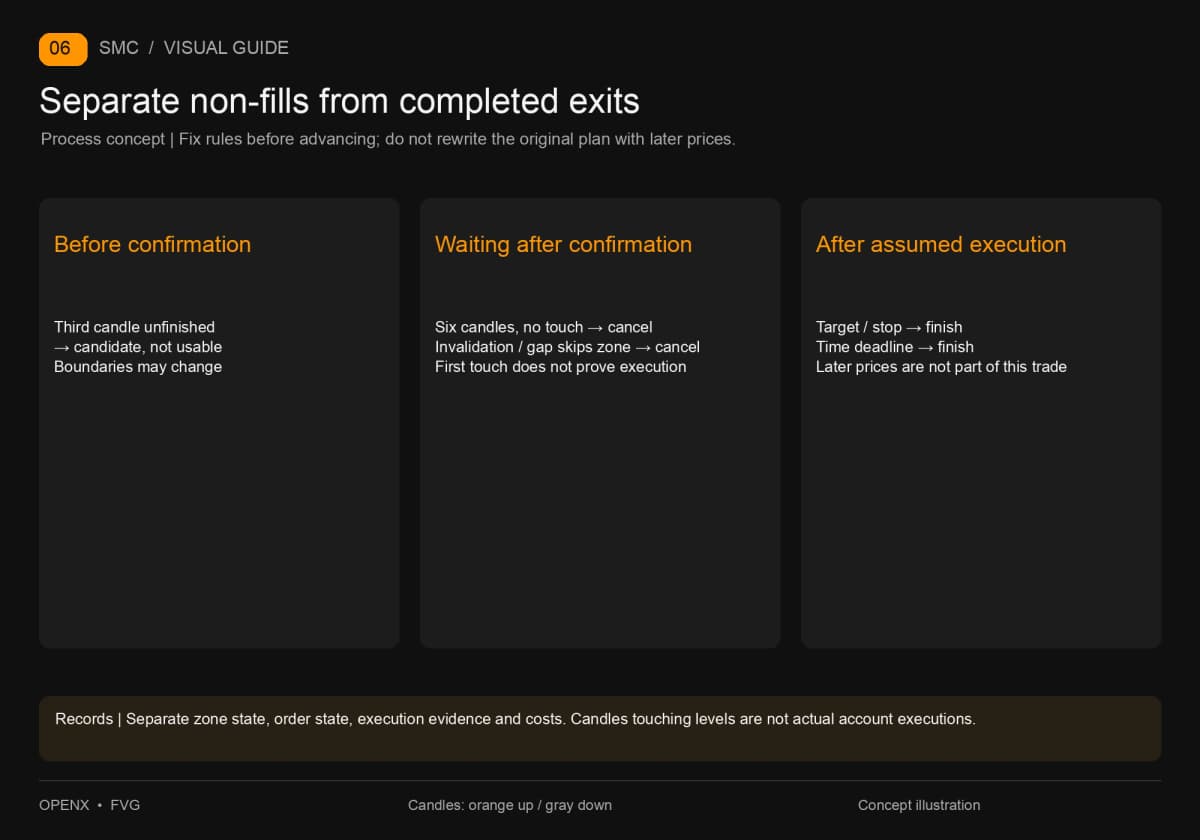
Wait only for the six four-hour candles after confirmation, until September 11 at 20:00. Cancel if there is no fill. Also cancel if the zone is already invalidated by a close before execution, or new data jumps directly above the upper boundary; do not assume an execution inside a skipped interval. Do not open a second trade after the first use. Once filled under the assumptions, exit at the stop or target. If neither is reached, close by September 12 at 00:00 using the first executable price then available. This time exit is not used in the example.
Assume a 10,000 USDT account and a 0.5% risk budget: 50 USDT. Ignoring costs, the size ceiling is approximately 0.275634 BTC. Reduce it to 0.25 BTC for this example, giving planned price risk of 45.35 USDT. If we additionally assume a fee rate of 0.01% on each side and execution at the specified entry and stop, round-trip fees are 0.25 × (77,518.6 + 77,700.0) × 0.0001 = 3.880465 USDT. The total is 49.230465 USDT.
That fee rate illustrates the calculation; it is not the exchange's current quotation. The amount remaining within the 50 USDT budget is no guarantee of sufficient slippage allowance. Actual orders also require checks of quantity increments, account fee rates and other holding costs. This calculation describes position risk, not the required margin.
Step 3: Use one-minute data to locate the first actual touch
After confirmation, the four four-hour candles from September 10 at 20:00 through September 11 at 08:00 have highs of 77,316.0, 76,988.0, 77,400.0 and 77,469.3. None reaches the lower boundary. The September 11 12:00 candle spans entry, target and stop, so the four-hour chart alone cannot establish their order.
On the fifteen-minute chart, the 12:00 and 12:15 candles still do not touch the zone. The 12:30 candle has a high of 77,671.4 and low of 76,000.3, spanning both entry and target. This still does not settle the sequence. Move to one-minute data rather than immediately counting the low as profit.
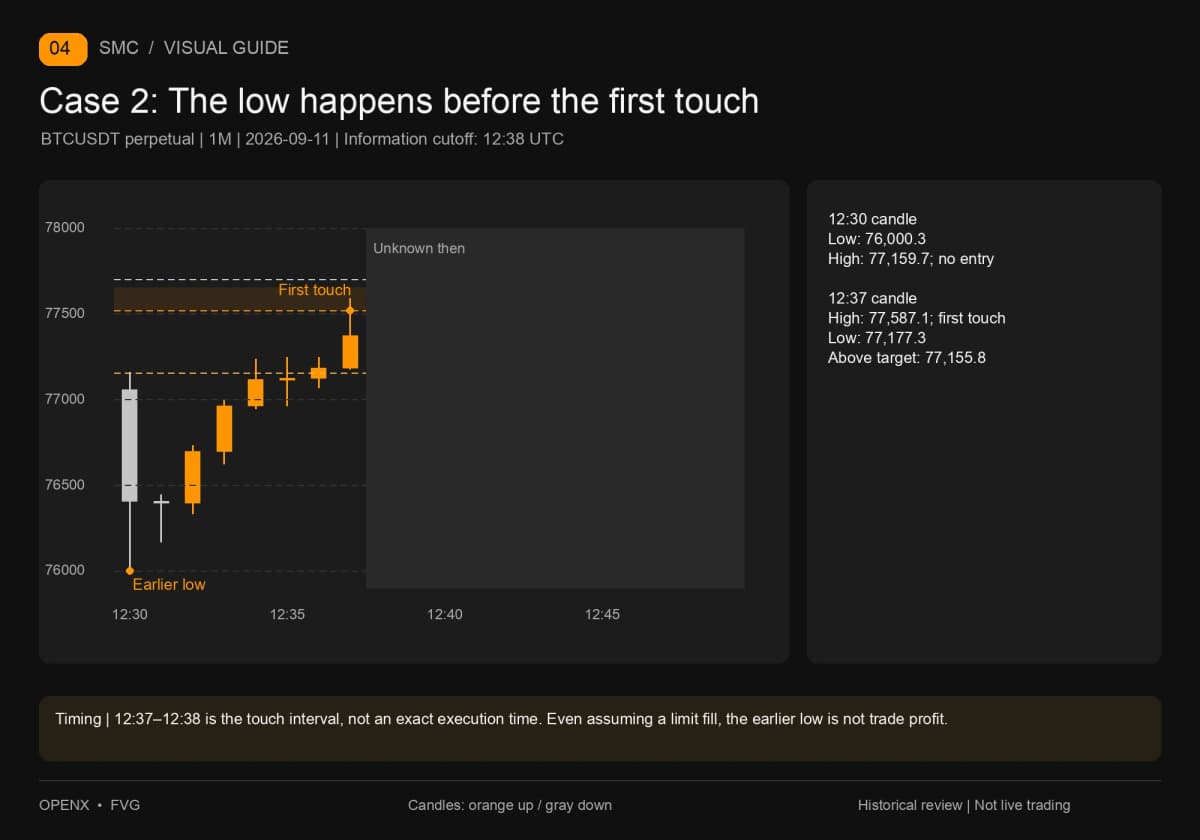
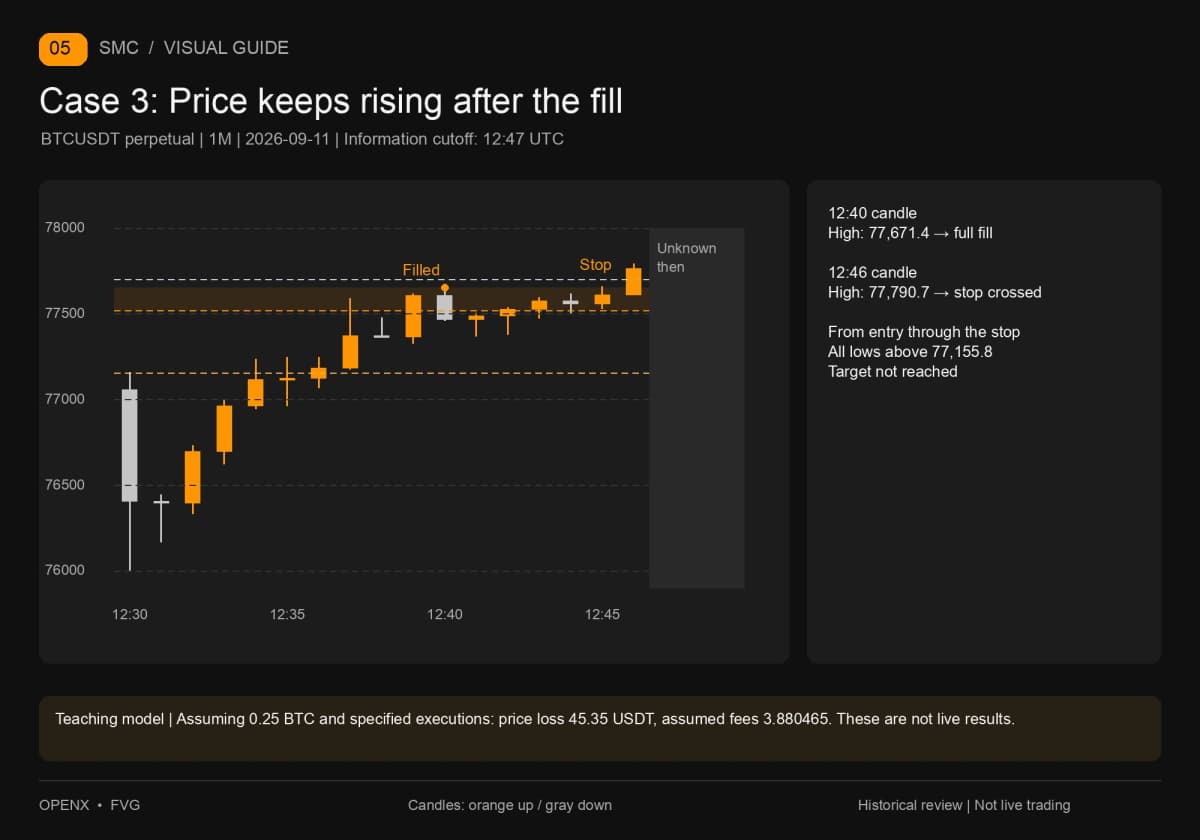
The 12:30 minute first reaches 76,000.3, with a high of only 77,159.7: no entry touch yet. Every subsequent high through 12:36 remains below 77,518.6. The first candle to cross the lower edge is 12:37, with a high of 77,587.1 and low of 77,177.3. It does not reach the 77,155.8 target, and its high remains below the FVG's upper boundary. It establishes the first touch and a partial fill. The candle becomes fully known only at 12:38; its 12:37 label is not an exact execution timestamp.
Only a model assuming continuous prices and execution of the limit order starts the trade here. Candles contain neither queue priority nor personal account execution reports. If the order did not actually fill, record it as unfilled. However attractive the 12:30 low looks, it preceded this assumed entry.
Step 4: After the complete fill, the stop comes before the target
The 12:40 one-minute candle reaches 77,671.4, crossing the upper boundary at 77,651.4 and completely filling the FVG. Filling the rectangle does not require price to reverse. From the entry candle at 12:37 through 12:45, every low remains above the 77,155.8 target. At 12:46, the high reaches 77,790.7, crossing the 77,700.0 stop; its low of 77,608.6 also stays above the target.
Under specified-price execution assumptions, the stop therefore comes first: a price loss of 45.35 USDT, or 49.230465 USDT with the assumed round-trip fees. There is no account execution evidence, so these figures cannot be recorded as live performance. Four-hour closing invalidation waits until 16:00, when the candle closes at 77,682.9, above the upper edge. The trade has already exited; the zone decision is not a reason to delay its stop.
Keep the sequence in one record: first touch at 12:37, complete fill at 12:40, stop crossing at 12:46, closing invalidation at 16:00. The first three labels identify minute intervals; the last is a four-hour completion time. A complete fill and a losing short are fully consistent.
Keep the unfilled page when practicing FVGs
The useful exercise is to finish the conditions before the next candle appears. Replaying the same window, first record the instrument, timeframe, three source candles, confirmation time and boundaries. Then record first use, cancellation deadline and exit rules. For fields you can fill directly, continue with the trading journal template — English link to follow. Retain untouched zones, canceled plans and actual non-fills. Use all plans to measure the proportion filled, but use only filled and closed trades for the win rate. Separate the denominators: cancellation is not a loss, and removing waiting records does not produce a measure of all plans' outcomes.
Write reasons for staying out as statements you can verify. “Price has not reached the lower edge” can be checked against the high; “it does not feel strong enough” is hard to apply consistently next time. A midpoint entry needs another rule set and record. Do not combine two execution conditions into one performance sample.
After the exercise, keep screenshots from confirmation and exit, labeling each information cutoff. The first shows only candles completed then and planned levels; the second adds the subsequent path. This distinguishes a failed initial directional assumption from a failure to follow waiting or exit rules, rather than merely selecting a prettier rectangle afterward.
The first-touch limit entry makes this example checkable. It is not a recommendation to place an order at every gap. If your method requires a lower-timeframe closing confirmation, define its reference and availability time first, then recalculate entry and stop distance. You cannot simply reuse this example's entry price or profit and loss.
Multiple timeframes make hindsight easy to import unnoticed. Displaying a four-hour FVG on a fifteen-minute chart still requires waiting for the third four-hour candle to finish. Several completed smaller candles do not make it available early. Before changing the displayed timezone, verify the data's actual candle boundaries. Different instruments, data sources or session boundaries may produce different three-candle sequences.
Finer data resolves the ordering here, but minute candles are not individual trades. If one minute still spans both entry and exit levels, obtain finer evidence or mark the outcome uncertain. Do not consistently choose the most favorable intrabar path. One example cannot establish whether FVG rules have an edge; that requires fixed rules, multiple samples and complete cost records.
Put the zone back into a complete plan
Once confirmation, fill and exit are separate, reconnect the zone to the wider process. Use the SMC strategy guide — English link to follow for direction and other concepts, the order block guide — English link to follow to compare source zones, and how to keep a trading journal — English link to follow for records. To repeat the case, hide prices after 12:37, write your plan, then uncover the next candles.
This article is for education and historical practice, not investment advice. Leverage, slippage, fees and non-fills can change contract-trading outcomes. The example figures are not achievable-return promises.