A breaker block studies the opposite role of an invalidated order block. LuxAlgo's Volumetric Order Blocks documentation also describes extending a broken zone. This guide defines separate closing-invalidation and opposing-structure conditions, then waits for a retest only after both are confirmed. Unlike a false breakout identified by a cross and return, a breaker needs that prior zone history; formation does not guarantee profit.
When former resistance breaks, it is tempting to change the rectangle's color and start looking for longs. But did a wick cross it, or did price close above it? Was the opposing structure already confirmed? Until those questions are separate, changing the color may simply repeat the same mistake in the other direction.
We will clarify these conditions, then use the series' Bitcoin historical window to follow a bearish order block through invalidation, retest and exit. The case does not end with a handsome bounce. That makes it useful: a zone changing roles and a trade making money still have several steps between them.
A breaker studies how an existing zone changes sides
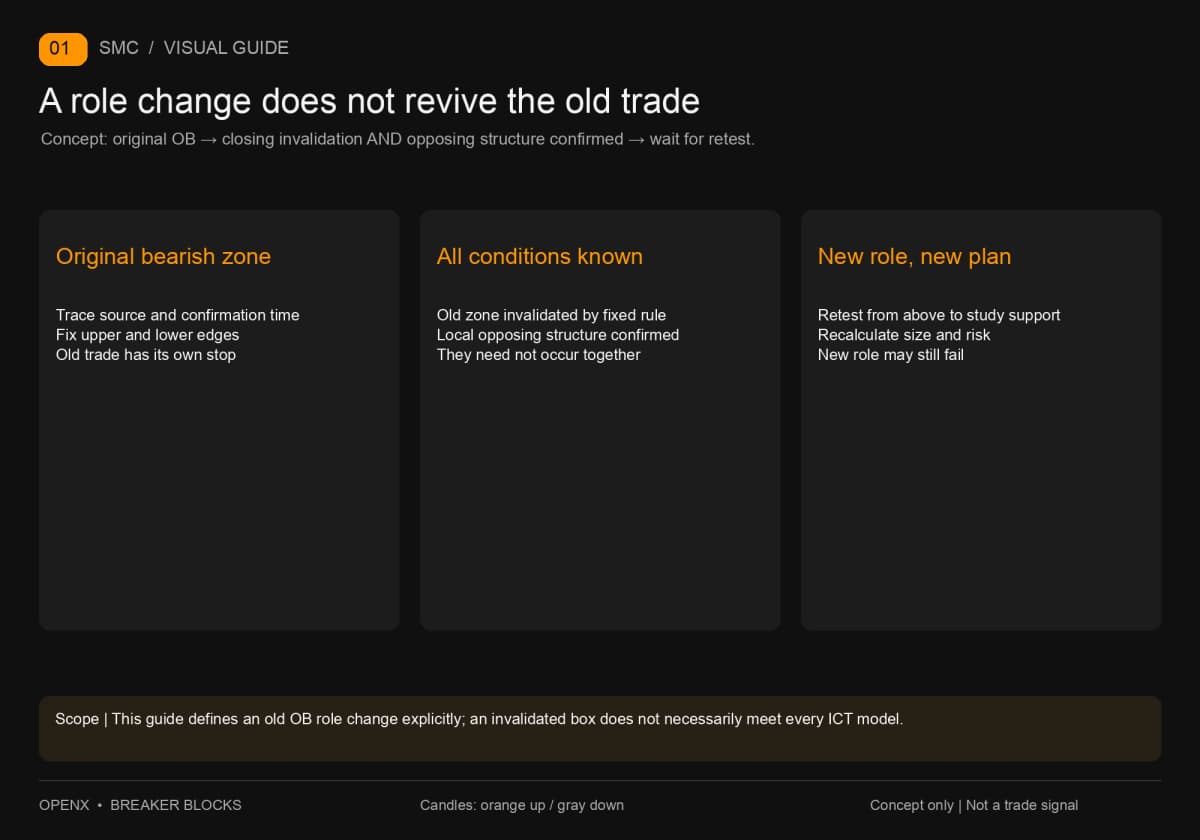
A breaker describes a change in a zone's role; it does not revive the original trade. After price crosses upward through an area previously watched for selling pressure, you can study whether a retest holds as support. Reverse the relationship when former support is crossed downward. First establish where the original zone came from. Do not wait for a bounce, then search backward for a candle to name.
The original order block (OB) here uses the full wick range of an opposing candle before a move, confirmed by a later close beyond a preselected reference. For the detailed drawing method, see the order block source and invalidation guide — English link to follow. Candles provide price information; the rectangle does not reveal how many institutional orders remain there.
The original OB, invalidation and opposing confirmation have different jobs
The original OB identifies the zone to track. Its invalidation rule determines when the original directional interpretation stops applying. Opposing structure asks whether price has broken the preceding local swing relationship. Record all three separately. This guide invalidates the OB with a close beyond its far edge and confirms opposing structure with a close above a previously confirmed local swing high, rather than relying on one large bullish candle.
Identifying that local high also requires waiting. In this example, a four-hour candle's high must exceed the highs of the immediately preceding and following candles. Confirmation waits until the right-hand candle closes. This is the example's fixed selection method, not a universal swing rule. The opposing break applies only at this local scale; it cannot establish a daily uptrend. For practice selecting swings, compare the market structure and confirmation timing guide — English link to follow.
Breaker implementations differ. LuxAlgo's official Volumetric Order Blocks documentation extends a broken original zone as a breaker and provides different invalidation settings. The source guide checked it on September 30, 2026. ICT refers to the Inner Circle Trader teaching framework, where stricter readings require particular liquidity sweeps and swing sequences. What follows is a rule-defined change in an existing OB's role. Do not claim that any invalidated rectangle meets every ICT model.
False breakouts, rejection blocks and propulsion blocks are not just colors
A false breakout focuses on price crossing a reference high or low and returning, without necessarily involving a previously identified OB. A rejection block focuses on a wick area associated with price rejection. A propulsion block commonly describes zone relationships during continued moves and still needs its own selection rules. They examine different features; they are not three synonyms for breaker. This article does not add those names as entry conditions and stack retrospective explanations onto the same sequence.
Compare which candle each method selects, when its information becomes usable and what price breaks its conditions. Drawing three boxes on one chart does not add information unless it adds verifiable rules.
Fix the rules before advancing the chart
Closing invalidation, a price stop and the start of a new plan must remain separate. If an old short hits its stop intrabar, that trade ends. If the four-hour candle eventually closes back below the zone, the original bearish area may still avoid closing invalidation. Neither outcome cancels the stop, and losing the short is not itself a reason to turn long.
After retaining the original OB, this example independently tracks the first four-hour close above its upper boundary. It also requires an earlier close above a local high and a prior-day-low cross followed by a return above it. The confirmations need not occur on the same candle; opposing structure may come first. Start the new plan only when every required condition is known. That is the sequence below: structure changes before the old OB is invalidated.
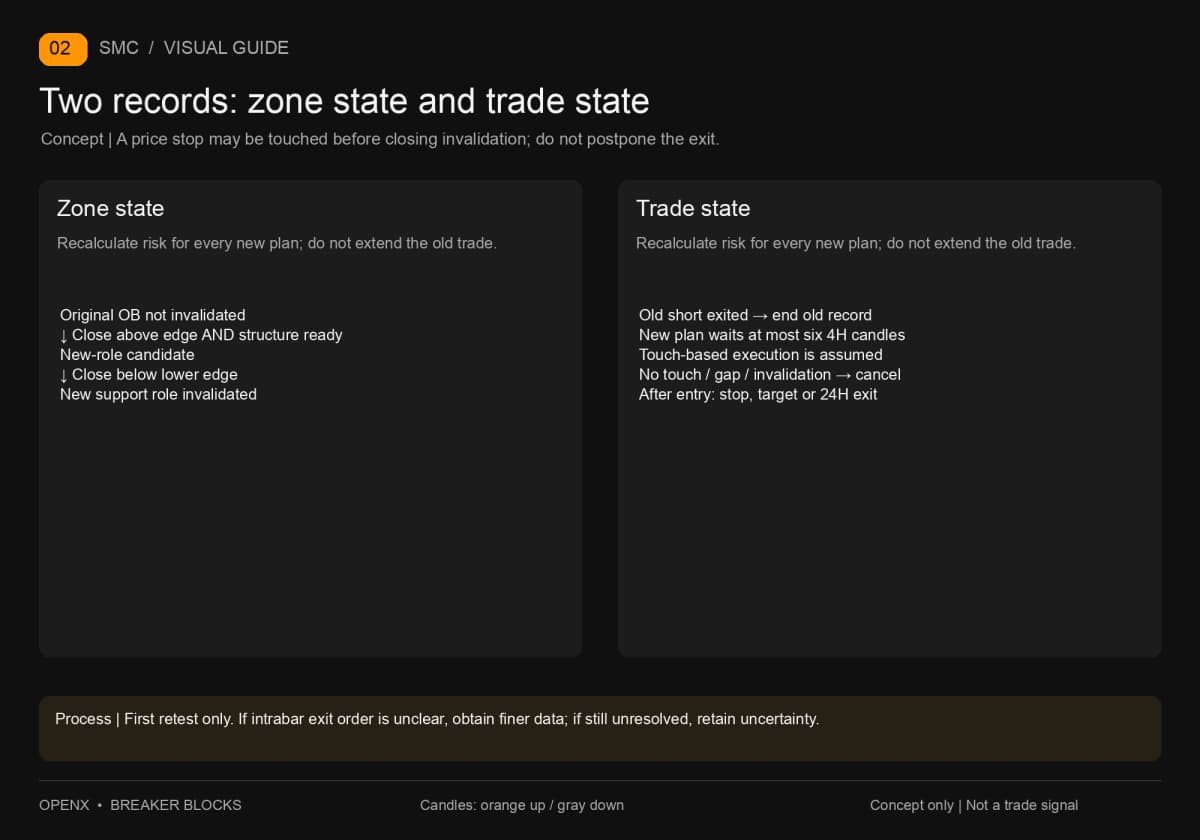
Starting with the next candle after confirmation, wait at most six four-hour candles. Study only the first retest of the old upper edge from above. Cancel if it never touches before expiry, if an opening gap skips directly below the lower edge, or if a close below the lower edge occurs before execution. An earlier low inside the confirmation candle is not a retest for the new plan; counting it would let the plan travel backward in time.
When the zone becomes usable, write entry, stop, target and position size together. The example uses a touch-based stop for the assumed trade, a four-hour close for invalidating the new zone, and a maximum holding time of twenty-four hours after entry. A stop or target ends the trade earlier. These are teaching rules, not a claim of a validated profitable strategy.
Two columns clarify the record. “Zone state” tracks an uninvalidated OB, a role-change candidate or invalidation of the new role. “Trade state” tracks waiting, assumed execution, cancellation or exit. An old short being closed while the zone remains under observation is consistent. A new long needs its own record; offsetting the two results does not turn them into one successful judgment.
Historical BTC example: new support can still fail
The case meets its conditions and retests, but the assumed long hits its stop first. The instrument is the Binance BTCUSDT perpetual contract: BTC means Bitcoin, and USDT is the quote stablecoin. A perpetual contract has no fixed expiry and differs from holding spot Bitcoin. The original data contains eighty-eight four-hour candles opening from September 2, 2026 at 20:00 through September 17 at 08:00. Retrieved again on September 30, it matches the series' saved data value by value. All times use Coordinated Universal Time (UTC). Add eight hours for UTC+8: the 20:00 confirmation discussed below becomes 04:00 the following day.
This is a teaching review of known history, not a blind test on an unknown market after locking rules. The old short's first-retest waiting period has already ended. The study below separately asks whether the old zone can change sides; it does not extend the original trade indefinitely. Prices are historical facts. Limit execution, account size and profit or loss calculations are assumptions, not live performance.
Step 1: Retain the original OB's source and confirmation time
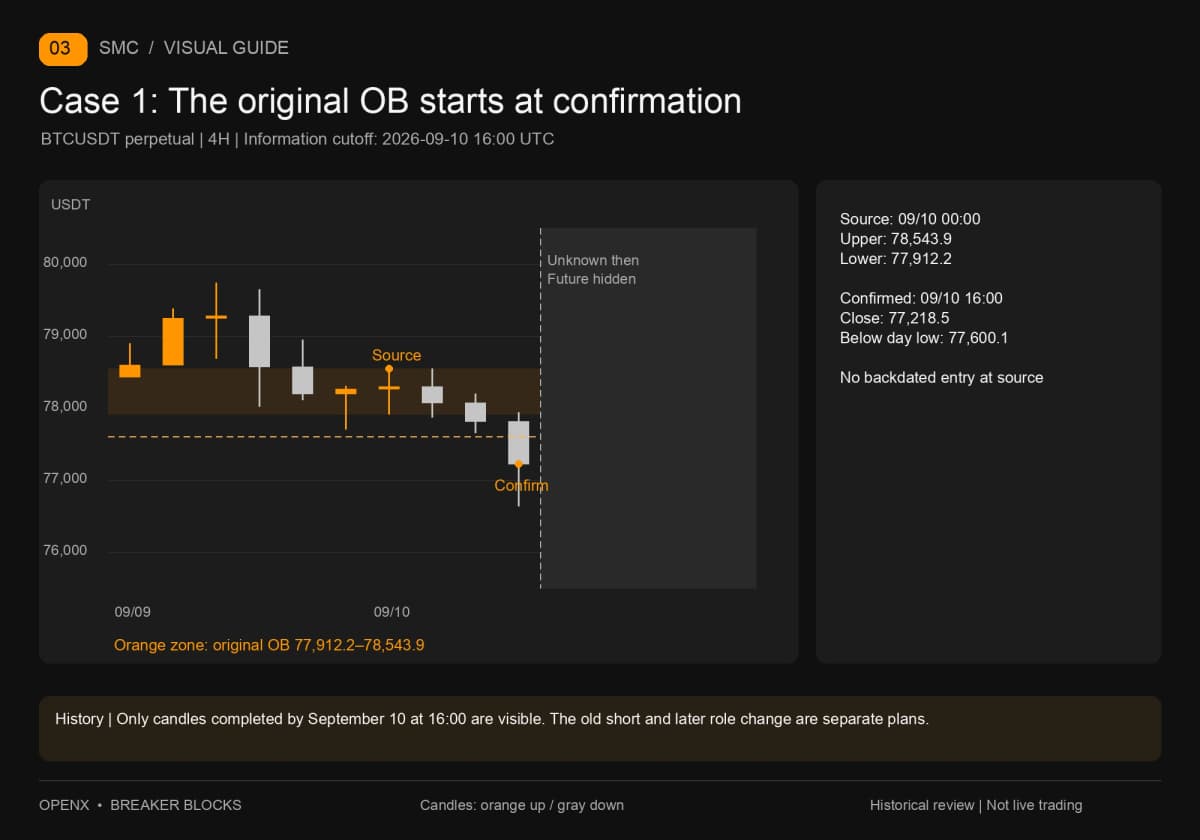
First reconstruct the original zone. The September 8 low is 77,600.1, fully known only by September 9 at 00:00. The four-hour candle opening September 10 at 12:00 closes at 77,218.5, confirming a close below that reference low at 16:00. Among the six completed candles before the break, the most recent bullish candle opens on September 10 at 00:00.
It opens at 78,264.0 and closes at 78,297.4, with a high of 78,543.9 and low of 77,912.2. Between the source and confirmation, price does not cross above the source's upper edge, so retain that full wick range. The source occurs overnight; the zone becomes usable in the afternoon. These are different timestamps.
Although the September 11 12:00 candle reaches 79,859.8, its 16:00 close is 77,682.9, still below the upper edge. Under this guide's closing rule, it is a wick crossing, insufficient to change the zone to an upward role. The series' OB teaching short has already hit its own price stop that day. That trade result does not cancel or replace the zone test.
Step 2: Wait for actual invalidation and check the opposing close
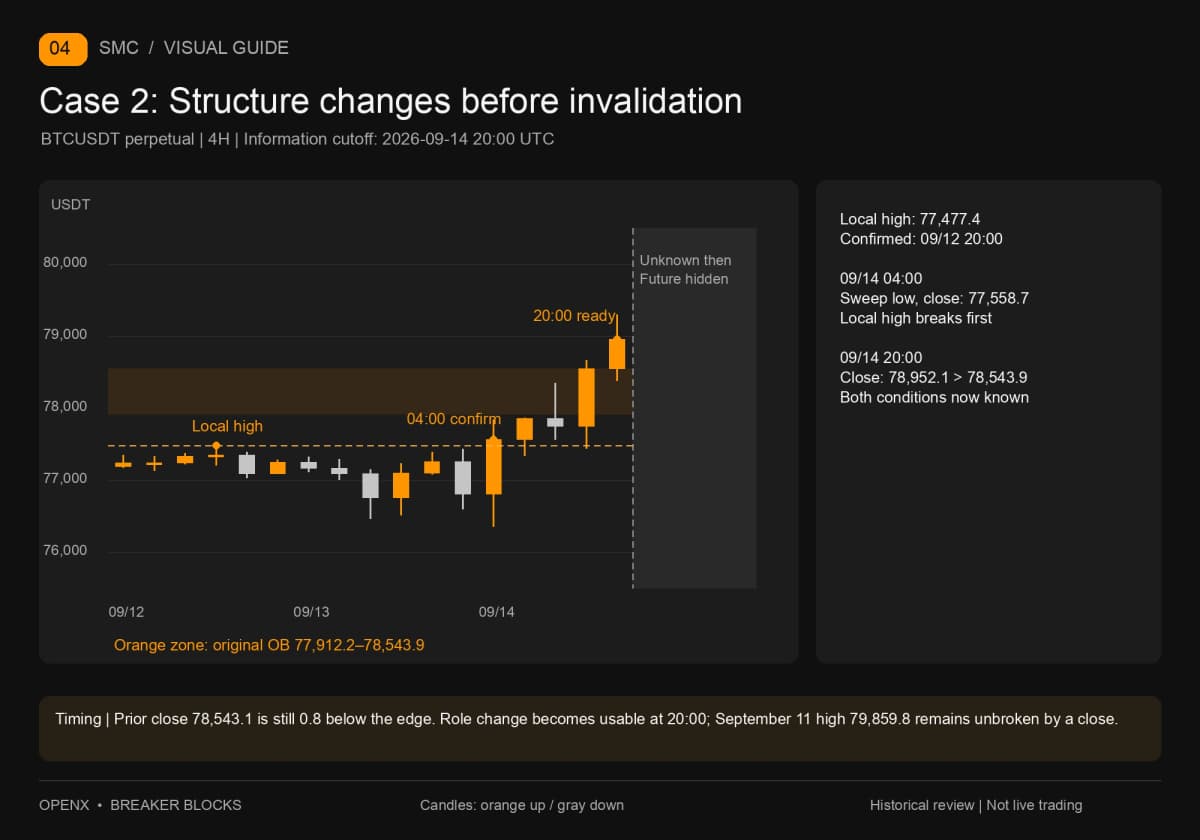
Retain the local structure next. The September 12 12:00 candle has a high of 77,477.4, above 77,369.3 on its left at 08:00 and 77,384.9 on its right at 16:00. Only after the right-hand candle finishes, on September 12 at 20:00, can this become the local high tracked afterward.
The September 13 daily low of 76,458.9 is known by September 14 at 00:00. The candle opening then reaches 76,350.1, crossing the previous day's low, and closes at 77,558.7. At 04:00, it confirms both a return above that daily low and a close above the local high. This supports the example's opposing-structure background, but it still has not closed above the original OB's upper edge. The new long cannot start yet.
Later, the September 14 12:00 candle closes at 78,543.1: 0.8 below the 78,543.9 upper edge. Do not round this into a break. The 16:00 candle finally closes at 78,952.1, establishing the first four-hour close above the original zone at 20:00. Only then are both the earlier structural condition and old OB invalidation satisfied.
This order matters. Opposing structure appears at 04:00; the role-change candidate becomes usable at 20:00. We have not compressed events sixteen hours apart into one tidy sequence of arrows. The change also concerns smaller local structure. Price has not closed above the September 11 high of 79,859.8.
Step 3: Calculate stop, target and size before the retest
After the 20:00 confirmation, the teaching plan assumes a limit long at the first return to the old upper edge, 78,543.9. Set the price stop at 77,850.0, below the original lower boundary of 77,912.2. The buffer is a teaching choice, not a necessarily safe distance supplied by the chart. Cancel if a cancellation condition occurs before execution rather than chasing a higher price.
Initial price risk per BTC is 78,543.9 − 77,850.0 = 693.9 USDT. A fixed target of twice that risk, or 2R, is 78,543.9 + 2 × 693.9 = 79,931.7. This target comes from the advance calculation, not a later high selected to improve the reward-to-risk ratio.
Assume a 10,000 USDT account and 0.5% single-trade risk budget: 50 USDT. Before costs, the size ceiling is 50 ÷ 693.9, approximately 0.072056 BTC. Round down to 0.072 BTC for the example, giving price risk of 49.9608 USDT. This is a quantity illustration. Actual orders still require checks of quantity increments, margin and fees. A risk budget is neither margin nor a guarantee of the maximum possible loss.
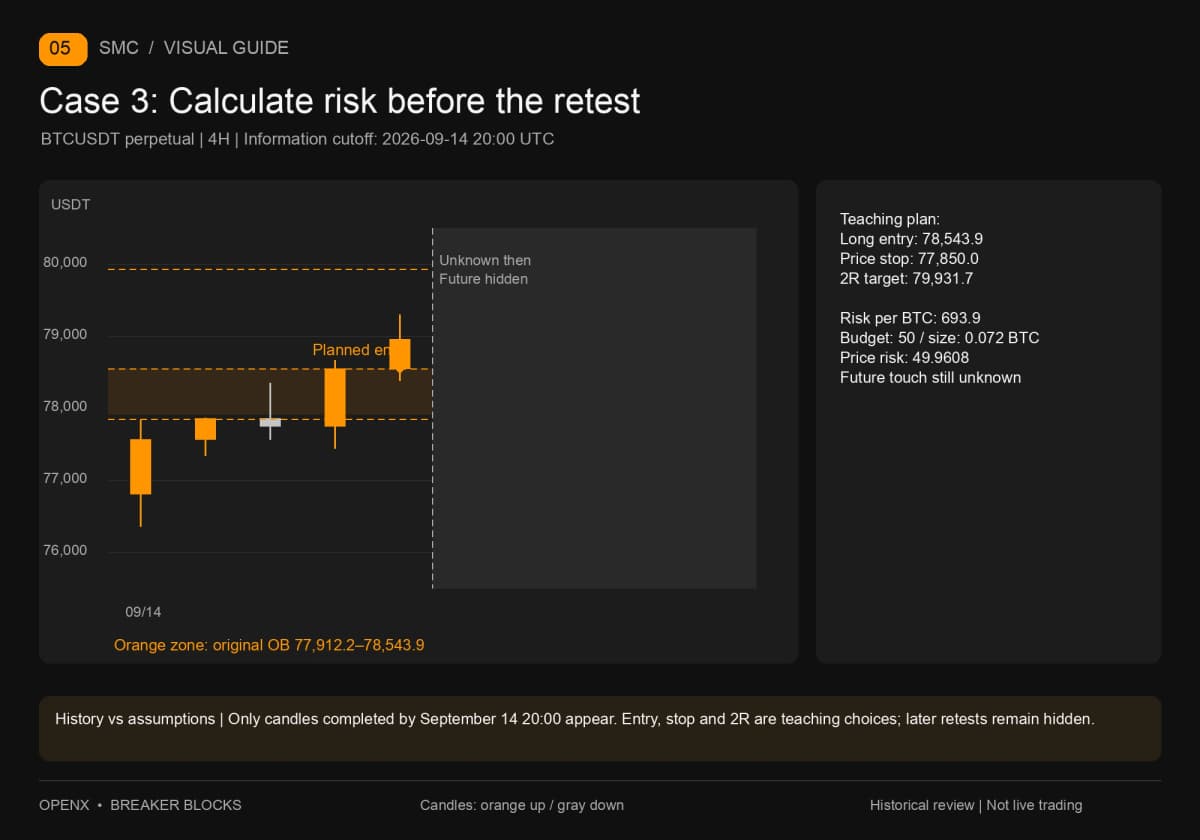
Step 4: Retest first, then check the stop and invalidation
The first candle after confirmation opens September 14 at 20:00: open 78,952.0, high 79,570.9, low 78,084.6, close 78,153.3. Its range includes entry, but the high does not reach the target and the low does not reach the stop. Under a simplified model of continuous prices and limit execution as assumed, record the first-retest entry. The data proves only that price touched within these four hours; it contains no queue information or actual execution report.
The next candle opens September 15 at 00:00: open 78,153.0, high 78,223.3, low 77,622.0, close 77,658.6. Its high is below the target and its low crosses the stop, so the assumed trade hits the stop first. Entry and stop occur in different candles, and neither candle reaches the target. This conclusion requires no guess about whether the high or low came first inside one candle.
The four-hour data still does not reveal the exact minute of the stop. Record the interval 00:00–04:00 rather than inventing an execution timestamp. At 04:00, the close also lies below the original lower edge of 77,912.2, confirming invalidation of the new support role under this guide's closing rule. The price exit occurs first; the close-based judgment completes later. Do not wait for the latter to decide the former.
If both executions occur at the specified prices, the price loss is 49.9608 USDT. Fees, slippage and possible holding costs are additional. Neither the six-candle waiting period nor twenty-four-hour holding limit runs to completion: the first retest occurs and the assumed trade exits earlier. Without an actual fill, record a non-fill rather than assigning this loss to the account.
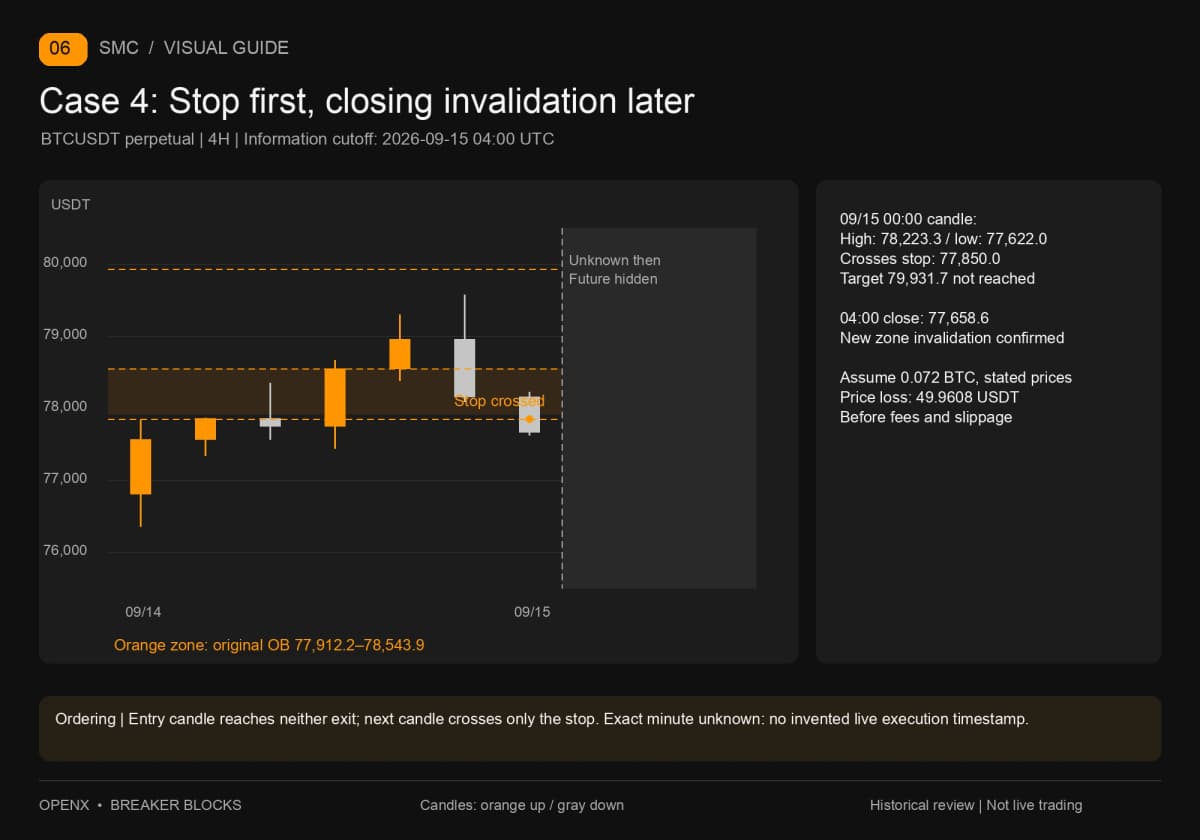
Common mistakes: a name cannot keep a trade alive
A stopped-out short does not establish a new long; a stopped-out long does not immediately justify another short. Every direction change needs new conditions and a new risk budget. Otherwise the same zone keeps switching between “OB,” “breaker” and “false breakout” while the account's exposure never stops.
Confirmation delay is another trap. Local highs need the right-hand candle; zone invalidation needs the close. A marker drawn back at an earlier location was not necessarily usable then. Pause a replay at confirmation, record only visible zones and levels, then advance. Keep untouched zones, canceled waits and incomplete data, not just successful charts.
This case uses full wick boundaries and a single retest. Candle bodies, midpoint entries, lower-timeframe confirmation or wider stops may change execution timing and outcomes. They need separate tests; do not switch after seeing this stop. Recalculate costs for the new size, especially with narrow price distances where fees can consume an apparently adequate reward-to-risk ratio.
Next steps: reconnect the zone to the complete process
To repeat the case, fix the original zone, then record structural confirmation, closing invalidation, the new plan becoming usable, the price touch and exit in order. Distinguishing these six timestamps is more useful than memorizing more block names. Continue with these site guides within Smart Money Concepts (SMC):
- SMC Strategy Guide: Core Concepts, a Worked Example and Risk Management — English link to follow, connecting direction, zones and risk.
- Order Blocks: Drawing OB Zones, Retests and Invalidation — English link to follow, checking the old zone's source and original trade.
- SMC Market Structure: BOS, CHoCH and Confirmation Timing — English link to follow, separating a swing's location from its availability. BOS means break of structure; CHoCH means change of character.
- Trading Journals: Plans, Fills and Trade Reviews — English link to follow, keeping price observations, assumed executions and costs in separate fields.
This article is for education and historical practice, not investment advice. One example cannot estimate a strategy's win rate. Actual trading includes non-fills, slippage, fees and leveraged-loss risks.