An order block (OB) marks a candidate retest zone using an opposing candle before a move; it is not visible institutional positioning. ChartLuma's official Order Blocks V6 documentation also identifies zones from source candles, though confirmation rules differ between methods. Unlike an OB, a fair value gap (FVG) uses a non-overlapping interval in a three-candle pattern. This guide defines its own close-beyond-reference rule, then uses historical prices to separate retests, zone invalidation and trading stops.
You draw an OB, price comes back, and eventually moves in the expected direction. Does that mean you got the trade right? Before moving to the next chart, check whether the retest hit your stop first. If it did, the later decline does not belong to that original trade. A long wick on a four-hour candle can hide this difference surprisingly well.
We will first specify which candle to select, how wide to draw the zone and what invalidates it. Then we will follow one Bitcoin sequence through confirmation, retest and risk calculations. Finally, we will open up the four-hour candle to check which level the teaching plan reached first. The result is an example you can repeat, including its failure.
An order block is an observation zone, not proof of institutional positions
An OB tells you where to watch for a retest; it does not tell you to enter simply because price touches it. It is a zone-reading concept within Smart Money Concepts (SMC). For how direction, liquidity and exits fit together, start with the SMC strategy guide — English link to follow. Here we examine the zone itself.
Bullish and bearish candidates: find the opposing candle
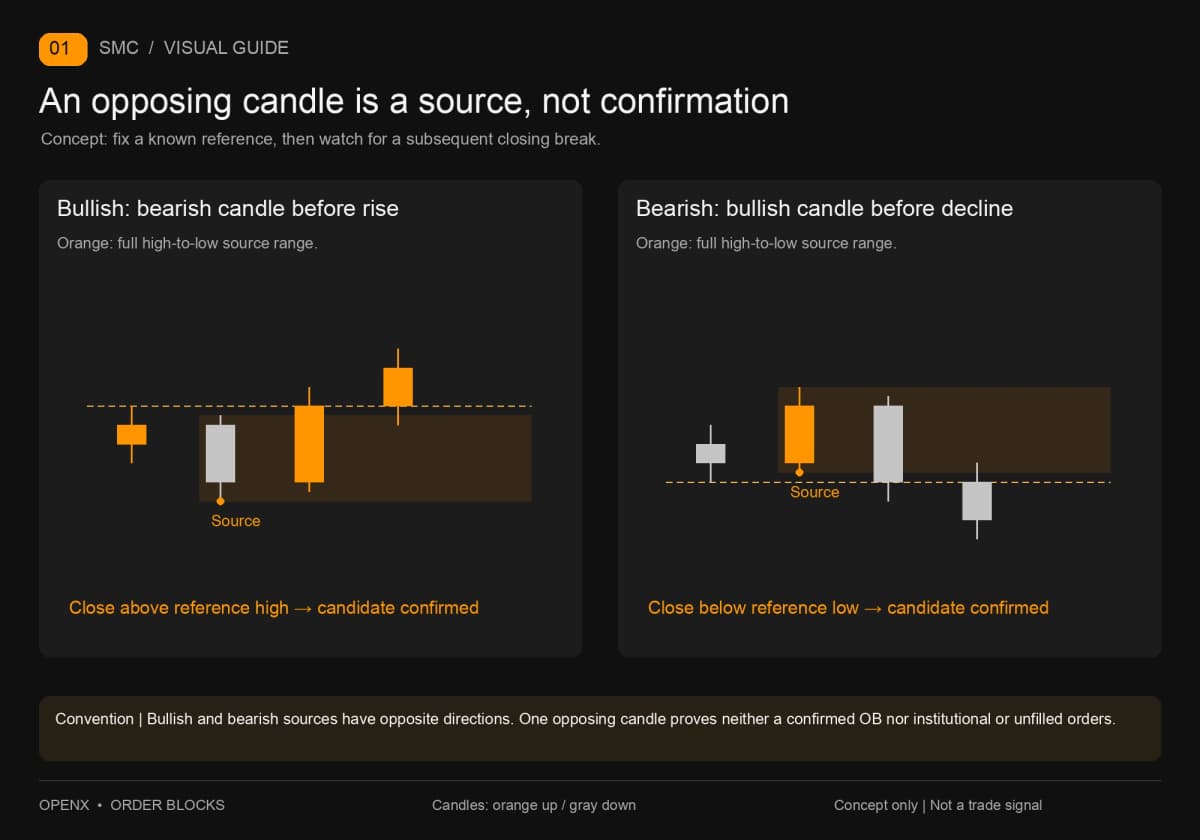
A common bullish OB candidate is a selected bearish candle before an upward move. For a bearish OB, reverse the relationship: look for a bullish candle before a downward move. Assess whether price subsequently leaves the area and meets confirmation conditions defined in advance. One opposing candle alone is not enough. Our model confirms with a close beyond a fixed reference, not a subjective judgment that a move looks strong enough.
Methods select points differently. ChartLuma's official Order Blocks V6 indicator documentation uses confirmation on the sixth candle after the source and explains that its volume panel is estimated from price data rather than actual order flow. The source guide checked this version on September 29, 2026. We use it only to illustrate differences in rules. The model below does not adopt that indicator's algorithm or performance figures.
Candles show where a period opened, how high and low it traded, and where it closed. Drawing an OB around a candle does not add the identity of an institution building a position or the quantity of remaining unfilled orders. I find acknowledging that limit makes the trading plan easier to check.
Drawing an OB: choose boundaries and invalidation together
Fix the source candle, zone boundaries and invalidation convention before price returns. We demonstrate one bearish model, not the only drawing method or a proven profitable approach. Complete rules are more useful than selecting the best-looking rectangle after seeing the retest.
Full range, body and midpoint are different plans
A full-range zone runs from high to low, including wicks. A body-only zone uses the interval between open and close. The midpoint is the average of the selected interval's edges. These choices alter touch timing, waiting distance and stop distance; do not swap them during a trade. Below we use the full wick-to-wick range, and the midpoint is not an entry condition.
When price rebounds toward a bearish OB from below, it reaches the lower edge first; the upper edge lies farther away. That spatial relationship does not guarantee the lower edge will hold. Waiting for a deeper retest means accepting that an order may not fill. Entering near the zone means accepting that price may continue farther into it.
Record confirmation, retest, invalidation and stop separately
The example uses the completed September 8 UTC daily low. UTC means Coordinated Universal Time; a day here runs from 00:00 to 00:00 the next day. From September 9 onward, wait for the first four-hour close strictly below that low. Then select the most recent bullish candle—close above open—from the six completed candles preceding the breakout candle. If none exists, abandon the candidate. Also reject it if any high between the source and confirmation has already exceeded the source's upper edge.
This restriction prevents choosing any attractive bullish candle from the whole chart. After confirmation, wait only through the next six four-hour candles. Record the first price-range overlap with the zone as the retest. Cancel if it never arrives. Also cancel if price gaps directly above the upper edge; do not assume a fill at the lower edge. You may draw the source marker back on its candle, but its availability time is the confirming close.
The four states below answer different questions; none substitutes for another.
| Item | Convention in this guide | What it does not mean |
|---|---|---|
| Zone confirmation | Close below the reference daily low; source passes selection | Institutional resting orders have been identified |
| First retest | First entry into the full range after confirmation | An order at a specified price must fill |
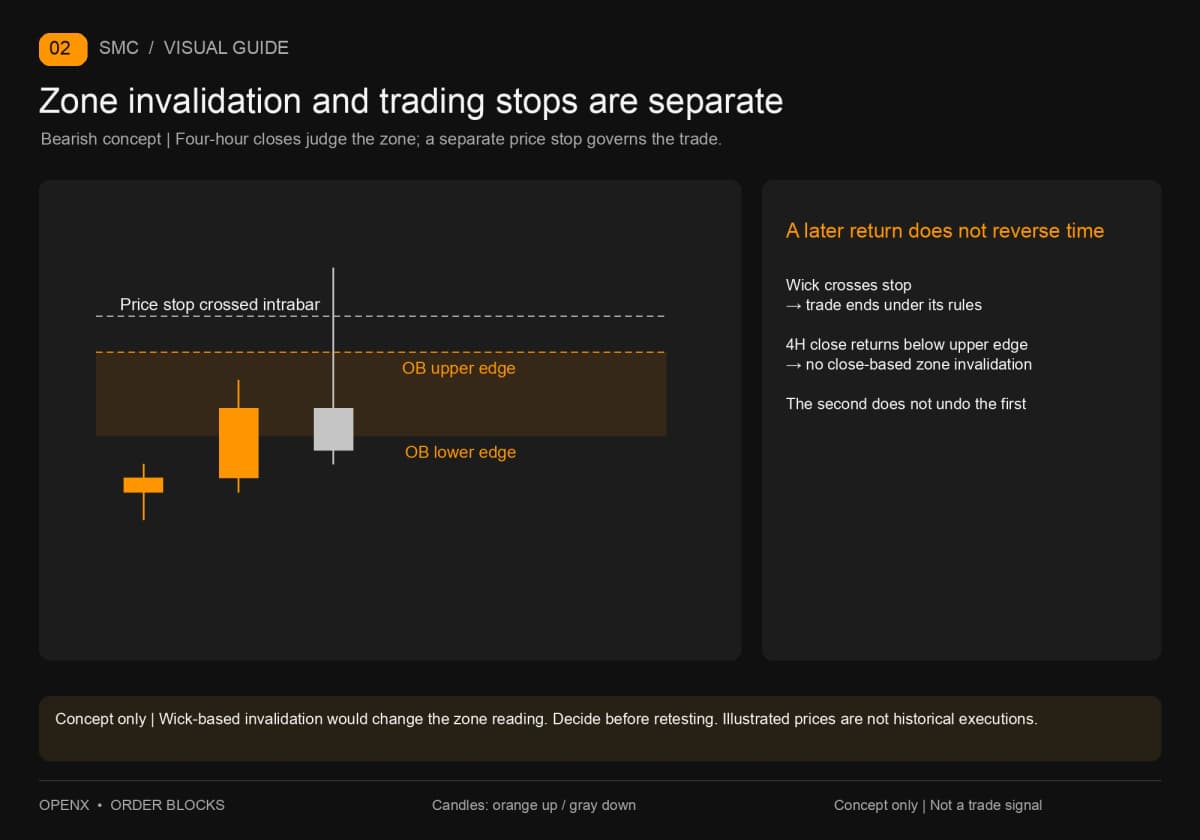
| Zone invalidation | Four-hour close strictly above the upper edge | A price stop should wait for the close |
| Price stop | A separate touch-based exit for the teaching trade | A later return cancels an exit that already happened |
A close exactly at the upper edge is an unresolved boundary observation, not strict invalidation. After the first retest, this model does not reuse the zone for a new entry, though close-based invalidation can still be tracked separately. Missing data, expiration or broken conditions end this waiting period. Selecting a different source does not extend the same plan.
Historical BTC example: the OB survives, but the short stops out first
We use Binance BTCUSDT perpetual contracts, derivatives without a fixed expiry, not spot Bitcoin ownership. BTC is Bitcoin and USDT is a stablecoin; prices are quoted in USDT. The source guide retrieved data again on September 29, 2026: 88 four-hour candles opening from September 2, 2026, at 20:00 through September 17 at 08:00 UTC, plus all 96 fifteen-minute candles for September 11. Aggregating each fifteen-minute group reproduces that day's four-hour prices.
This interval was already used in the series. It is a teaching review of known data, not a blind test. Entry, stop, target and account amounts below are teaching assumptions. We check the sequence that price data supports, without claiming actual orders or fills at those prices.
Step 1: Wait for the closing break, then lock the source candle
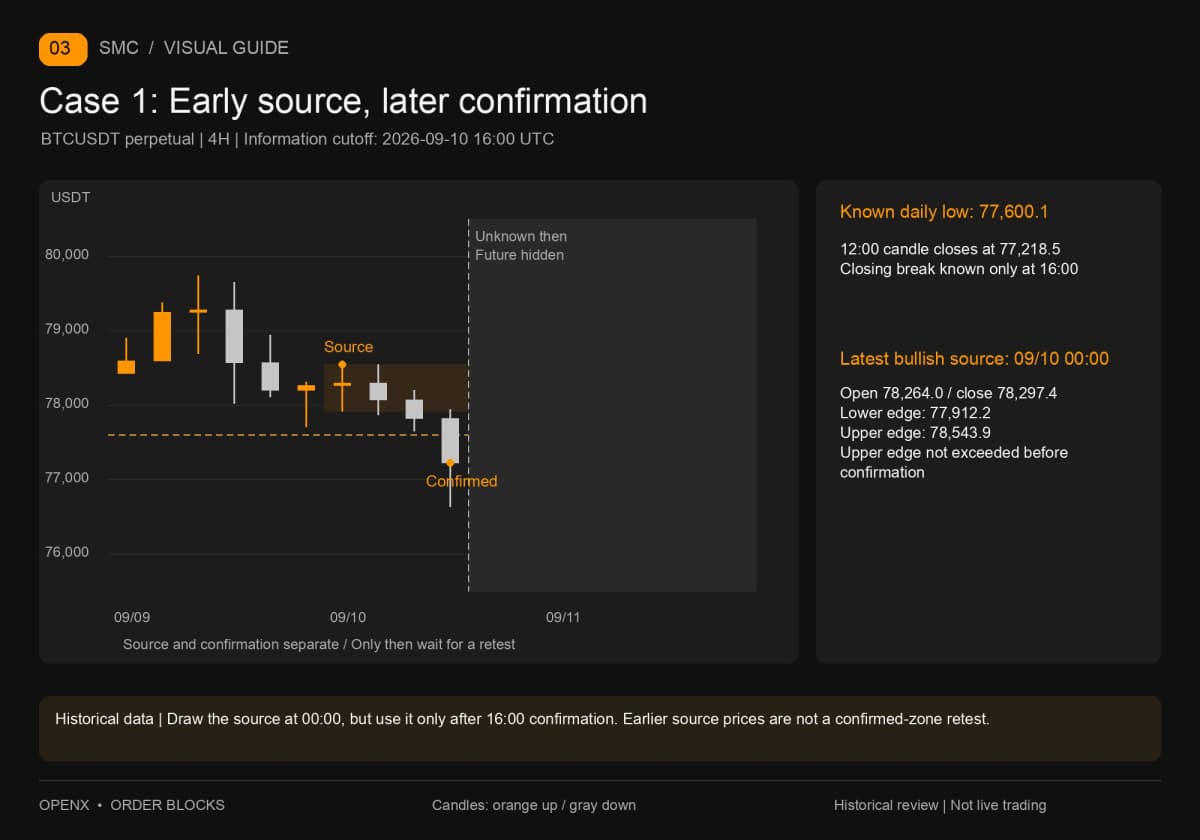
September 8's low is 77,600.1, fully known by September 9 at 00:00. The first subsequent four-hour candle to close below it opens on September 10 at 12:00 and closes at 77,218.5. Confirmation is available only at September 10, 16:00, not at the candle's 12:00 opening.
Among the six candles before the break, the most recent bullish one opens on September 10 at 00:00: open 78,264.0, close 78,297.4, high 78,543.9, low 77,912.2. The 04:00 and 08:00 candles afterward are bearish, with highs of 78,542.0 and 78,195.7. The breakout candle's high is 77,935.8. None has exceeded the source's upper edge first.
Only at 16:00 do we lock the bearish candidate at 77,912.2–78,543.9. Its source occurred at 00:00, but became usable at 16:00. Counting the source candle's own wick as a later retest would trade a zone that had not yet been confirmed.
Step 2: Calculate risk and cancellation before the retest
A limit order specifies an acceptable execution price; a touch does not guarantee a fill. Our teaching plan assumes a limit short at the lower edge, 77,912.2, on the first retest, a price stop at 78,600.0, and a target at twice the initial risk. The 78,600.0 stop is a teaching buffer chosen for this example, not a price derived from the data or a universal OB stop. Wait up to six candles; cancel if untouched or already invalidated on a close. Do not chase or enter again on a second retest.
Planned price risk per BTC is 78,600.0 − 77,912.2 = 687.8 USDT. 2R means twice the risk defined beforehand, so the short target is 77,912.2 − 2 × 687.8 = 76,536.6. This is a precomputed target, not a selection of a new low appearing after confirmation. The future path is still unknown at the planning stage.
Assume an account of 10,000 USDT and a per-trade budget of 0.5%, or 50 USDT. Before costs, maximum quantity is 50 ÷ 687.8, approximately 0.072695 BTC. We use 0.072 BTC, giving a planned price loss of 49.5216 USDT. An actual order would require checking the instrument's quantity step and reserving budget for fees, possible slippage—the difference between expected and actual execution prices—and other holding costs. This is neither a guaranteed maximum loss nor the margin requirement.
Step 3: The first retest is not the earlier low
The first five four-hour candles after confirmation do not reach the lower edge. Their highs are 77,518.6, 77,316.0, 76,988.0, 77,400.0 and 77,469.3. An unfilled order is also a valid outcome of the plan. Do not see a decline and pretend you had already shorted at the OB's lower edge.
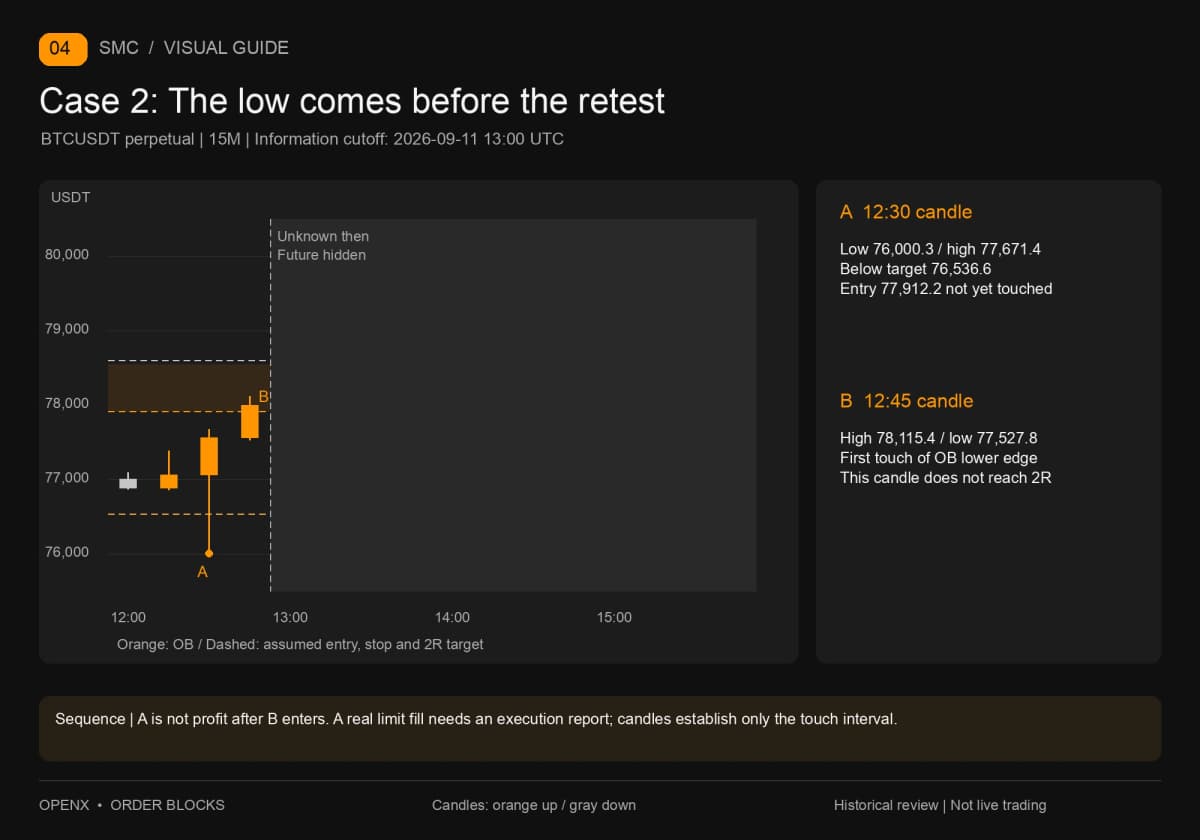
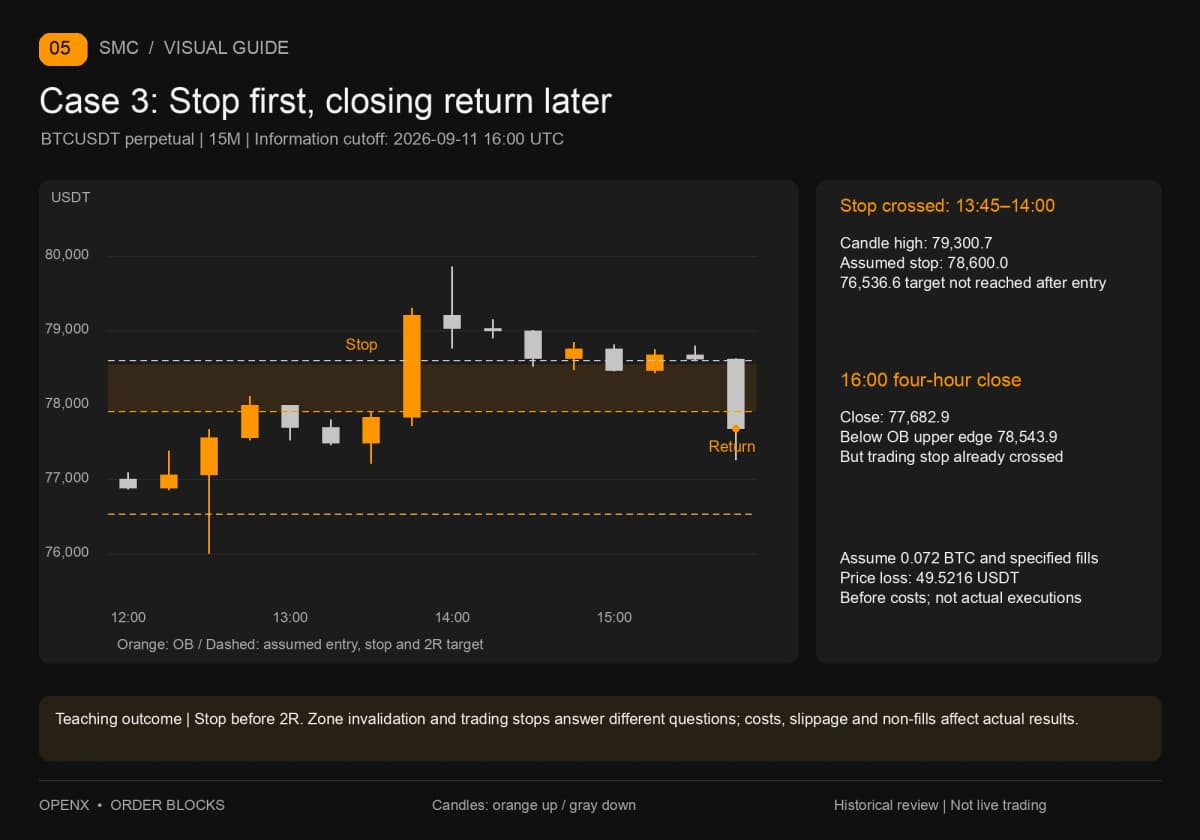
The sixth candle opens on September 11 at 12:00, reaches a high of 79,859.8 and a low of 76,000.3. Its range includes entry, stop and target. This four-hour candle alone cannot establish their order. A low below the target is not enough to record a winning trade.
On the fifteen-minute data, the 12:30 candle reaches 76,000.3 first, but its high is only 77,671.4, below the 77,912.2 entry edge. The first candle capable of touching entry opens at 12:45, with a high of 78,115.4 and a low of 77,527.8. Its low remains above the 76,536.6 target. Only after its 13:00 close can this dataset confirm that the touch occurred during that interval. The earlier move below the target is not profit from this hypothetical short.
Only in a simplified model assuming continuous prices and the limit order filling as specified can that interval count as entry. Candles contain neither queue information nor execution reports. An actual unfilled order must be recorded as unfilled, without assigning the later trading P&L to it.
Step 4: A four-hour return cannot undo a stop
After the entry interval, the 13:00, 13:15 and 13:30 fifteen-minute candles have lows of 77,526.4, 77,464.6 and 77,211.4. None reaches the 76,536.6 target. The 13:45 candle reaches 79,300.7, crossing the 78,600.0 stop. Its low of 77,720.0 does not reach the target either. The entry candle at 12:45 also missed the target, and entry touch and stop crossing occur in separate fifteen-minute intervals. The conclusion does not require guessing a path within one candle.
This assumed model reaches the stop before 2R. If all fills also occur at the specified prices, the loss before costs is the previously calculated 49.5216 USDT. Actual execution prices can differ. The stopped-out plan ends here; later prices do not belong to this trade.
At September 11, 16:00, the original four-hour candle closes at 77,682.9, below the OB's upper edge of 78,543.9. It therefore does not trigger our four-hour close-above-edge invalidation. There is no contradiction: the zone is not invalidated on a close, while the example's price stop has already been crossed. A wick-based invalidation convention would produce a different zone reading. Select it before the retest, not afterward to favor the result.
Keep these five moments together to see what a single higher-timeframe screenshot omits.
| Time (UTC) | What can be checked | Meaning for this plan |
|---|---|---|
| 09/10 16:00 | Daily low broken on a close; source range confirmed | Only now begin waiting for the first retest |
| 09/11 12:30–12:45 | Low reaches 76,000.3 before entry edge is touched | Not profit after entry |
| 09/11 12:45–13:00 | First touch of 77,912.2 | Trade begins only in the assumed-fill model |
| 09/11 13:45–14:00 | Price crosses 78,600.0 before reaching target | Teaching model stops out first |
| 09/11 16:00 | Four-hour close returns to 77,682.9 | Does not cancel the earlier price stop |
This example neither proves that OBs never work nor treats the later return as proof that this one worked. It shows why confirmation time, the path after entry and exit rules are all needed to assess a trade.
What a liquidation heatmap can add—and what it cannot prove
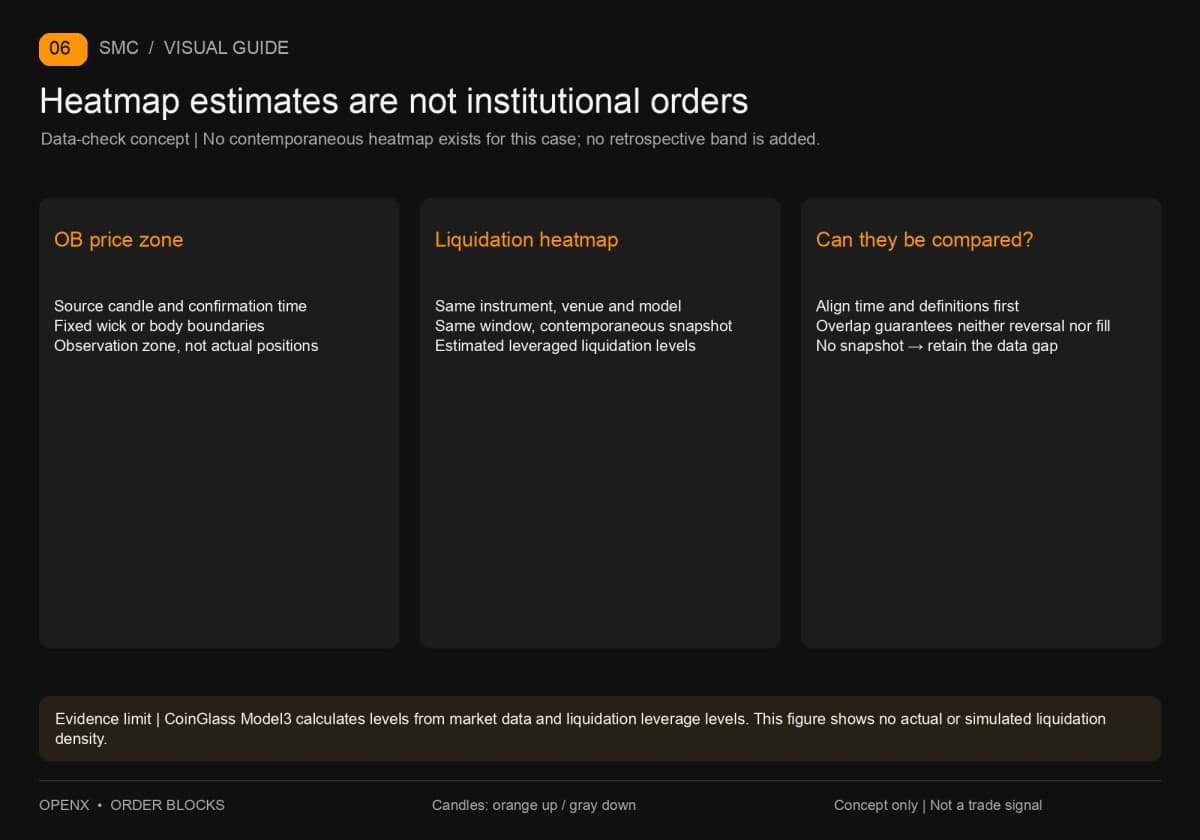
A liquidation heatmap estimates liquidation levels; it cannot prove that institutions have resting orders in an OB. Liquidation is the forced reduction or closure of leveraged positions when margin is insufficient. It is not the same as a trader's voluntary stop. CoinGlass's official “Pair Liquidation Heatmap Model3” documentation says its levels are calculated from market data and liquidation leverage levels. The source guide checked it on September 29, 2026.
Before comparing a heatmap with an OB, align the instrument, exchange, model, time window and the time the snapshot was captured. An overlapping bright band only means two methods point to nearby prices. It is not proof of completed liquidations, nor does it make the zone a guaranteed reversal point. A chart aggregating venues should not be treated as one exchange's order book without distinction.
This example has no heatmap snapshot from before entry, so we will not add a retrospective bright band to improve the candidate's appearance. The original candles support all confirmation and sequence checks on their own. To test whether heatmaps improve selection later, begin by saving contemporaneous snapshots and separate cases with data from those without it. A reconstruction made today is not what was visible then.
Order block mistakes and what to study next
The main mistake is letting the drawing follow the outcome. If full wicks require a wider stop, handle that when sizing the position. Do not calculate risk with a small body, then expand the box after taking a loss. Nor can a retested zone quietly become “untested” again so the same plan keeps restarting.
OBs and FVGs use different markings. An FVG is identified by a non-overlapping interval between the first and third candles' wicks in a three-candle pattern. This model did not require FVG filtering, and we will not add it after seeing the outcome. For combinations, continue with Further reading — English version to follow: What Is an FVG? Three-Candle Zones, Fills, Entries and Stops.
Another question is whether an invalidated zone can take the opposite role. A breaker block watches an original OB's role after invalidation, but still needs opposing-structure and retest conditions. A stopped-out trade does not automatically become a breaker. Further reading — English version to follow: Breaker Blocks: OB Invalidation, Opposite Confirmation and Retests develops that question.
This article is for education and historical practice, not investment advice. One example cannot establish a strategy's win rate. Actual trading involves non-fills, fees and slippage, and contract leverage can amplify losses.